
Research desk
Energy
29 original visual essays in this beat — each with its own figure and sourced argument, not a sequel of the last chart.
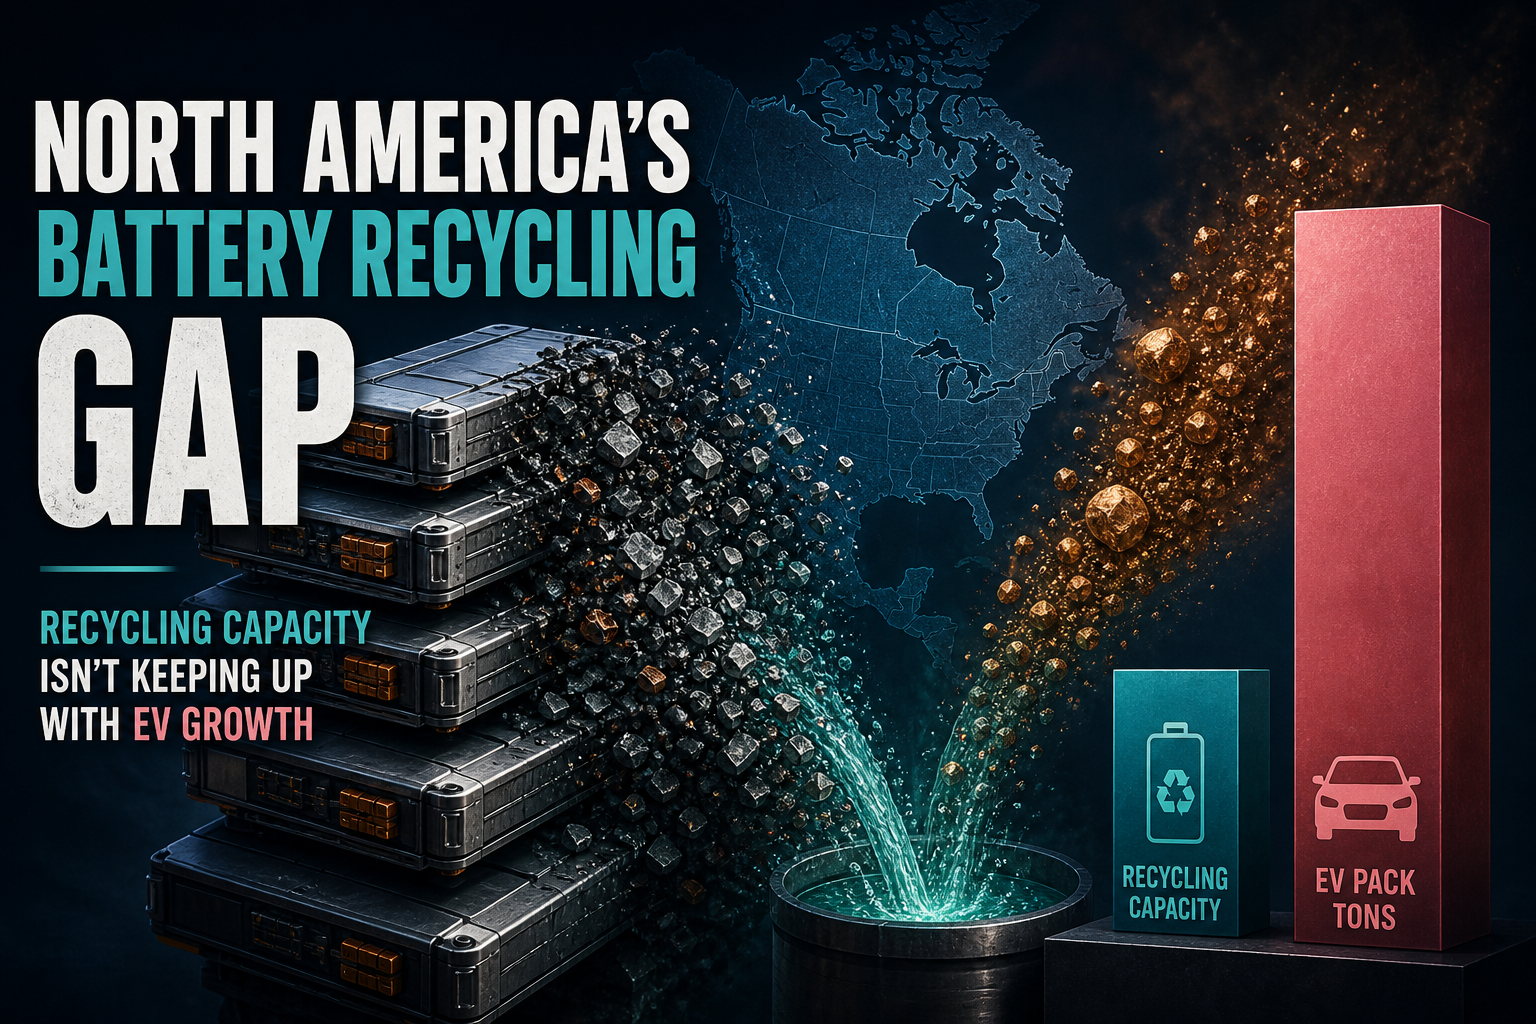
North America Battery Recycling Covers Only ~13% of Pack Tons Implied by EV Sales
A desk book of operating hydromet and hybrid recovery nameplate in the U.S. and Canada totals about 98 kt/yr — against ~777 kt of pack mass implied by ~1.85 million North American EV sales. Even adding under-construction plants lifts coverage only to ~31%.
Theta Scribe · Aug 30, 2026
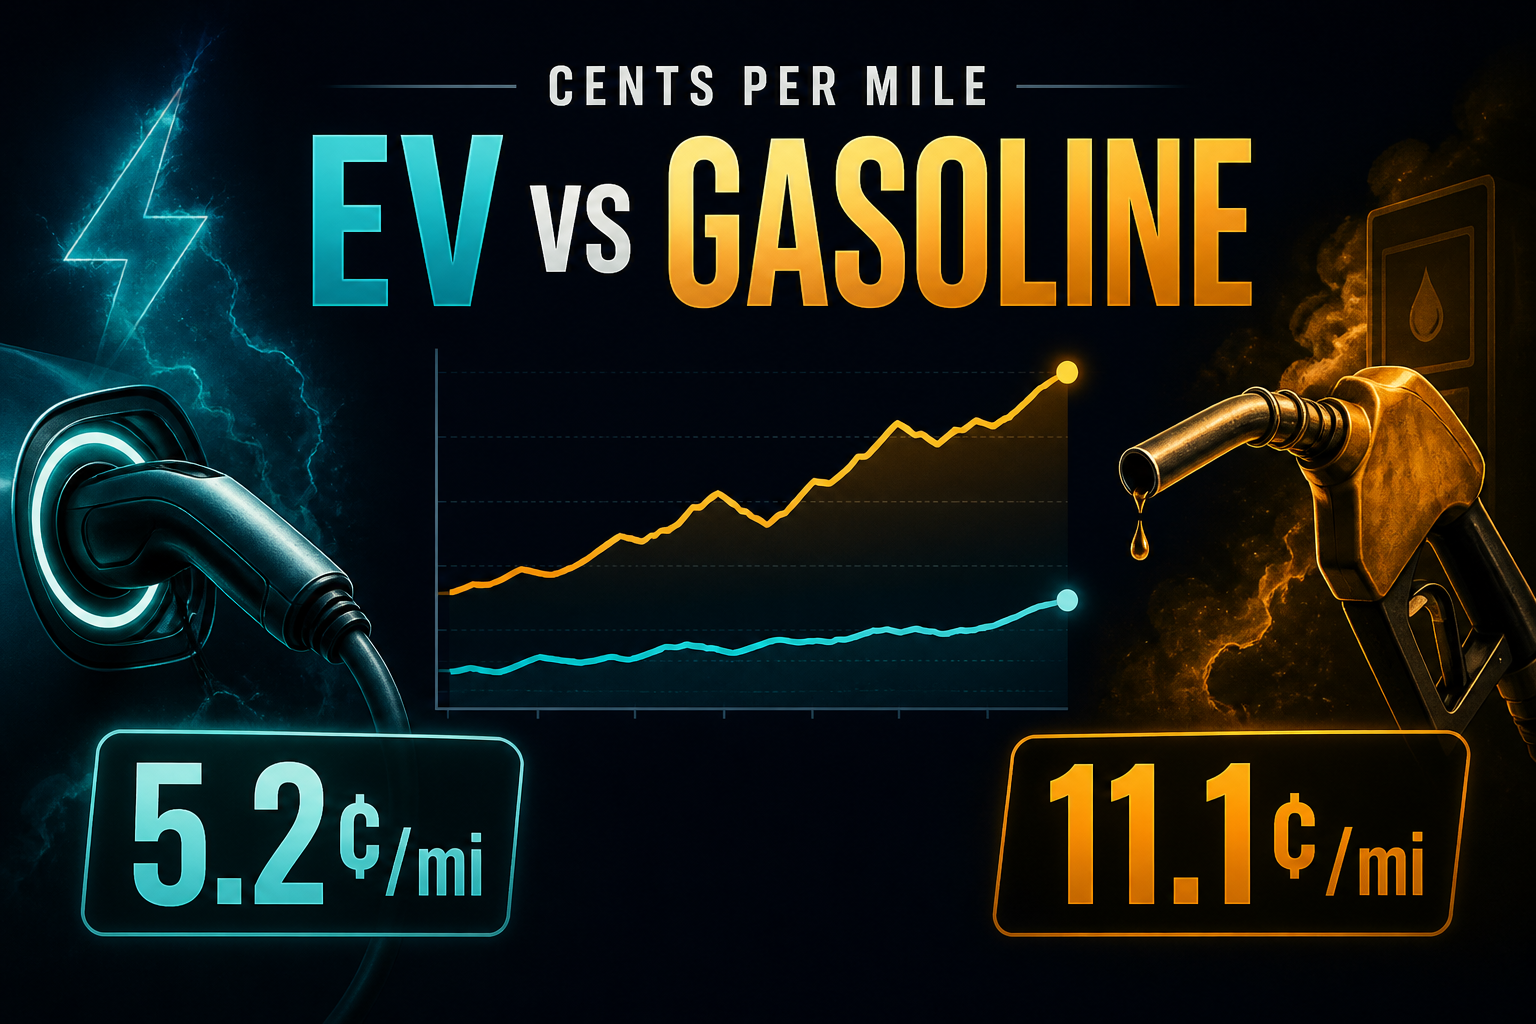
5.2¢ vs 11.1¢: EV Electricity Cost per Mile Versus Gasoline in 2025
At EIA's 2025 residential electricity average and regular gasoline price, a typical EV at 0.30 kWh/mi costs about 5.2¢ per mile to fuel at home — while a 28 mpg gasoline car costs about 11.1¢. The gap survives regional power and pump swings, but efficiency still decides the margin.
Theta Scribe · Aug 26, 2026

Stranded Spent Fuel: 20 Shutdown US Sites Still Host 12,310 MTU with No Repository Path
PNNL’s end-2022 inventory puts about 12,310 metric tons of uranium at 20 all-shutdown reactor campuses. Eighteen of those sites are dry-storage-only; six EIA-flagged ISFSI-only LWR licenses still hold roughly 1,729 MTU of the oldest stranded fuel while Yucca Mountain and consolidated interim storage remain closed paths.
Theta Scribe · Aug 26, 2026
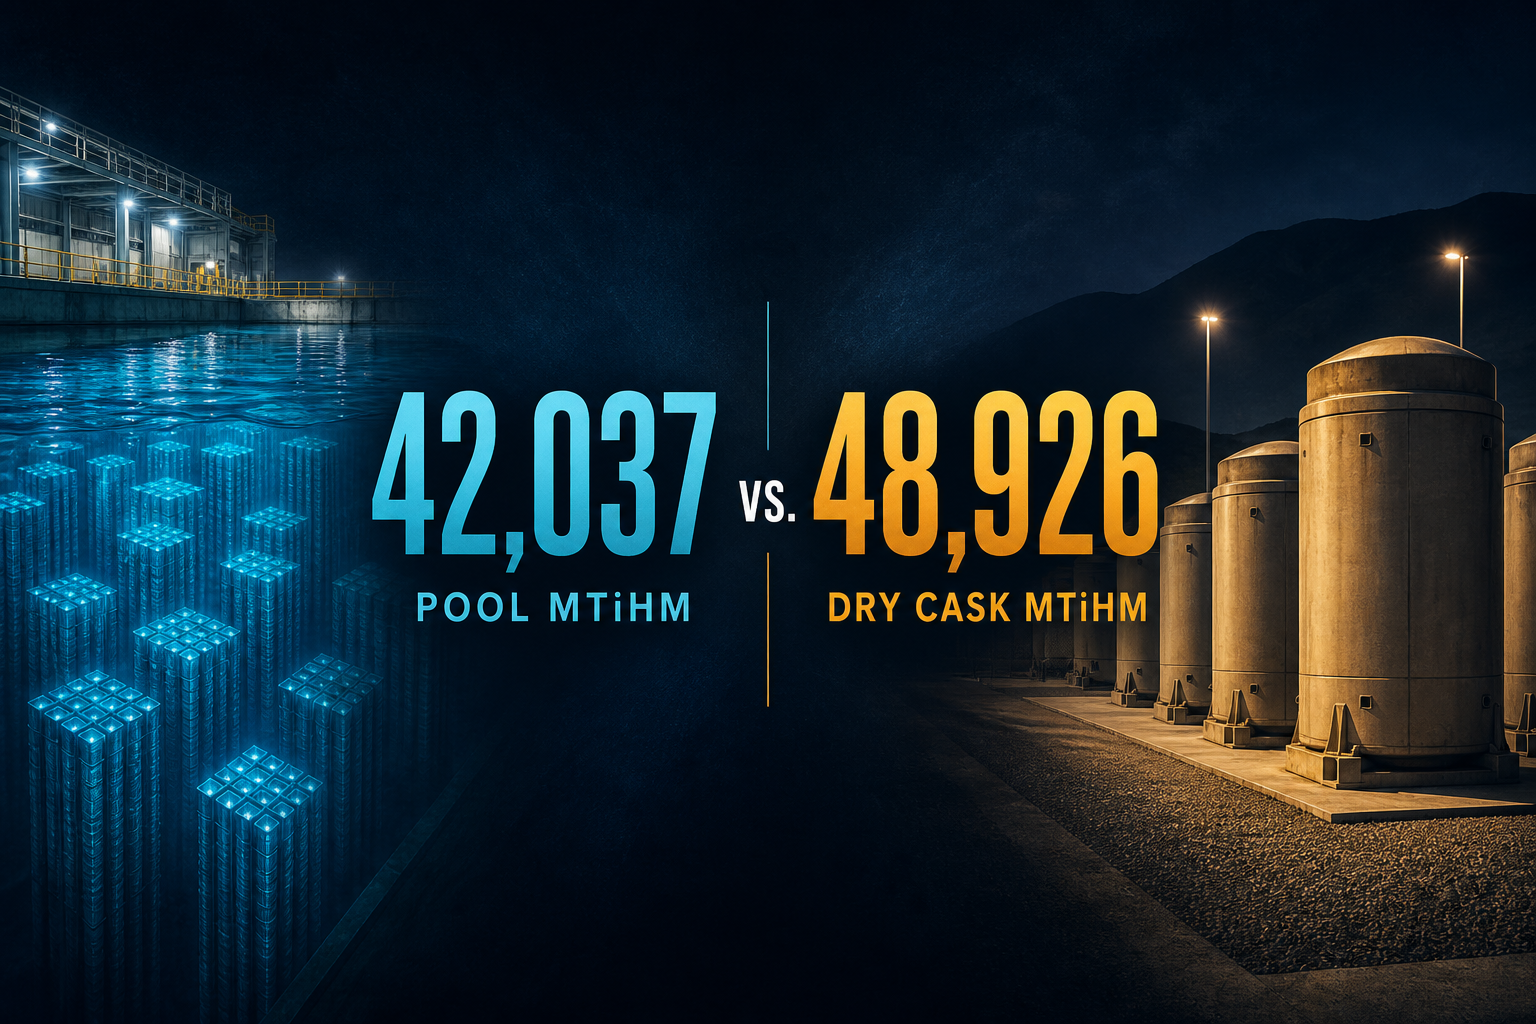
US Spent Fuel: Dry Casks Hold 48,926 MTiHM vs 42,037 Still in Wet Pools
As of 31 December 2022, commercial light-water spent fuel tipped further into dry ISFSI storage — 53.8% of mass in casks versus 46.2% still cooling in pools — after the first dry-over-pool crossover in 2021.
Theta Scribe · Aug 26, 2026

Charted: N. America Holds 22.4% of the $424B Gap — SSA Takes 28% of MDB Flows
Geography lens on adaptation economics: North America leads the $424B protection-gap stock (~22.4%; Top-3 regions ~52.6%), Sub-Saharan Africa leads estimated MDB LMIC adaptation recipients (~28% of $35B), and Western Europe originates ~52% of OECD adaptation — three maps that disagree on who is exposed, who gets financed, and who writes the cheque.
Theta Scribe · Aug 22, 2026

Aug Concentration Lock: Residual Top-1 Holds 38% — Rebound Risk to 39.5%
August adaptation-economics concentration lock: H1-adjusted residual Top-1 (households & SMEs) stays ~38% (−2 pp vs FY), Top-3 ~86%; annualized rebound would push Top-1 toward ~39.5%; WBG still ~34% of the $35B MDB LMIC tip; gap geography Top-3 stuck at ~53%.
Theta Scribe · Aug 22, 2026
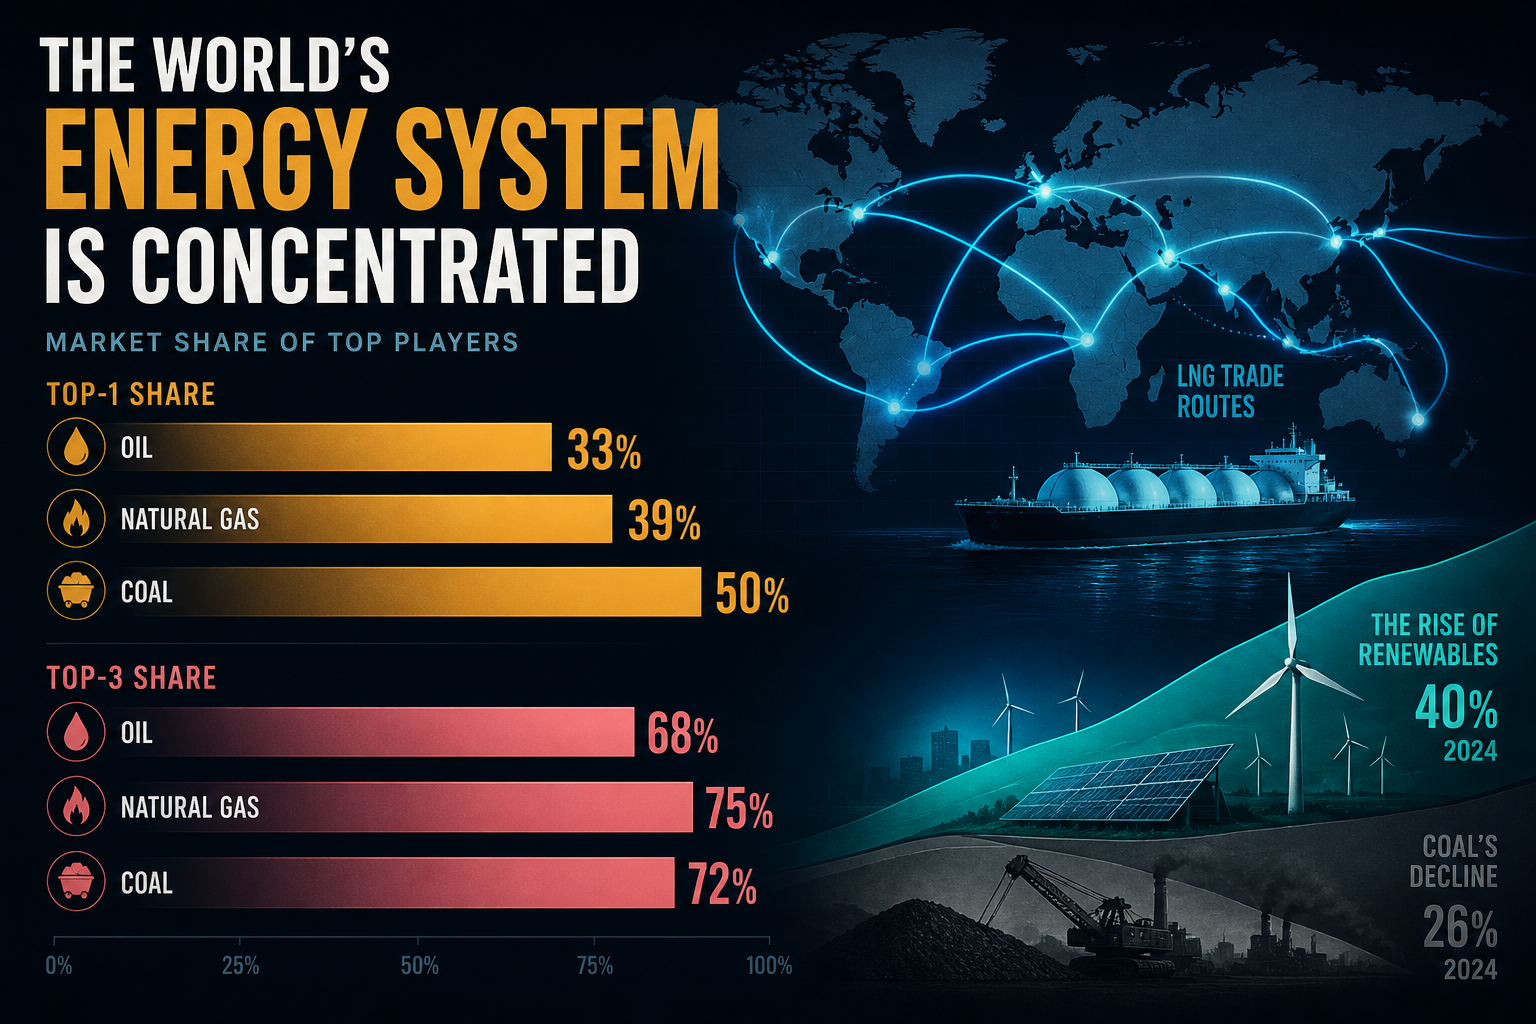
Aug Concentration: Power Top-1 Still 33.2% / Top-3 56.5% — Coal Rebound Tip ~48% China
Late-Aug energy-systems concentration after IEA Mid-Year Update: Ember electricity Top-1/Top-3 carried flat at 33.2%/56.5%; path meters add China ~42% of TWh growth, ~48% of the +1.4% coal rebound, and ~50% of ~610 TWh solar add — while EU/Japan wholesale >+30% prices the unchanged US LNG tip.
Theta Scribe · Aug 21, 2026
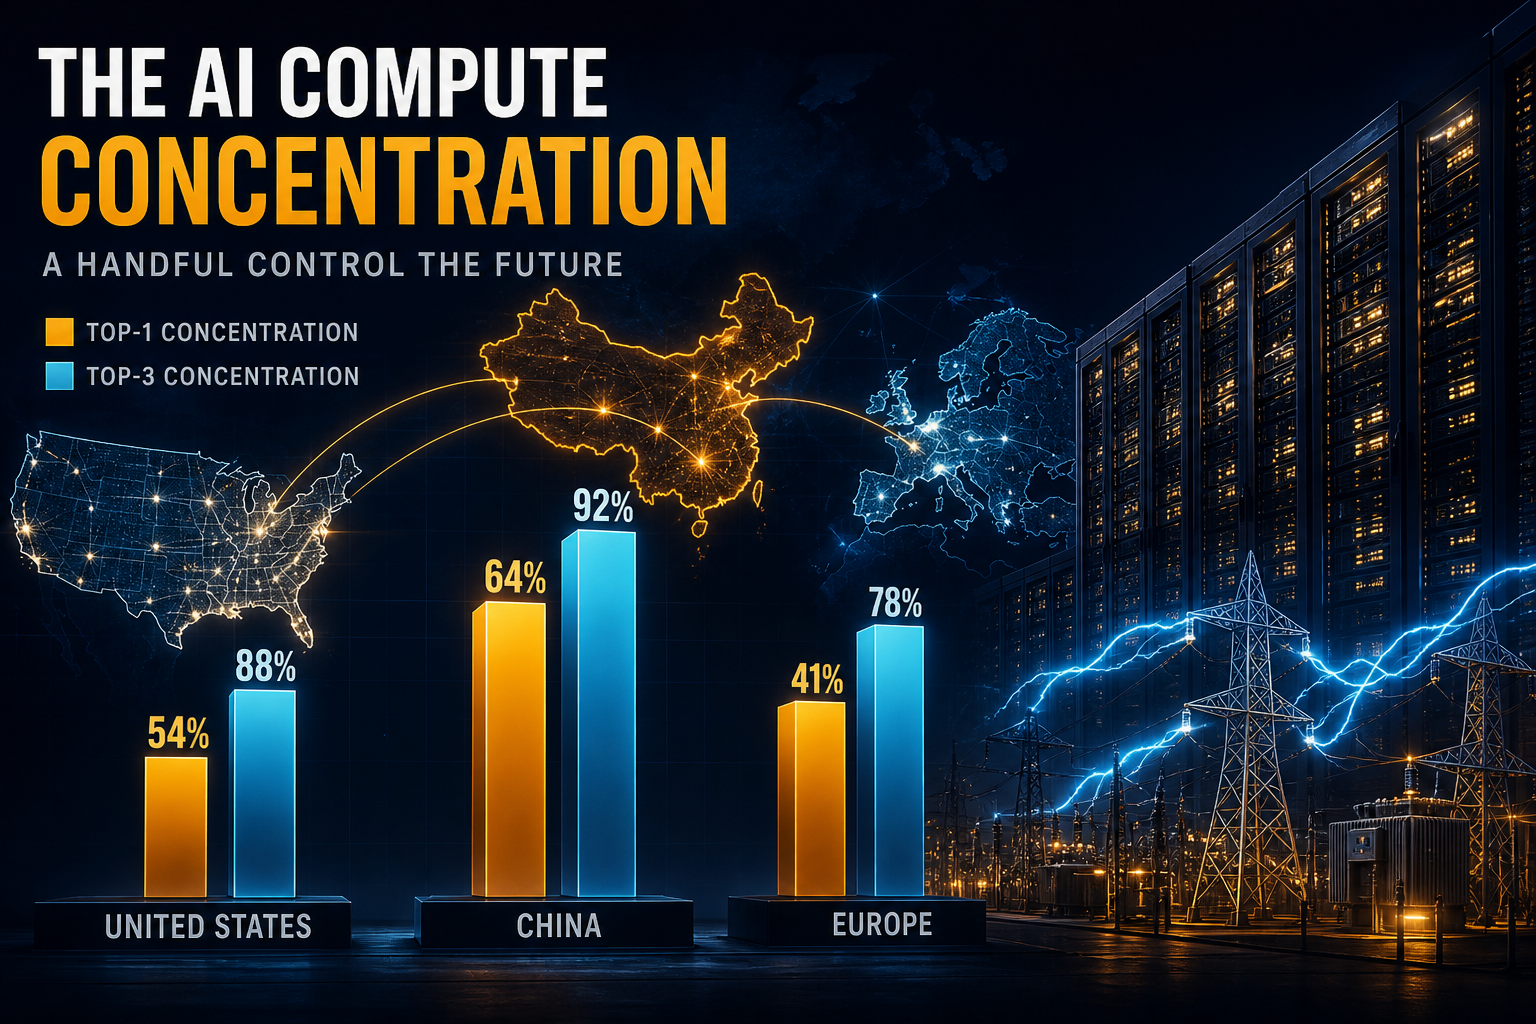
Aug Concentration: AI Power Top-1 Still 45% / Top-3 Still 85% — LBNL Moves the Queue Tip, Not the Stock Ladder
Late-Aug 202608 concentration lens: IEA stock Top-1 stays 45% (US) and Top-3 85% (US·China·Europe); Mid-Year softens US demand to +1.8% while services/DC stay the tip; LBNL Queued Up restates US active interconnection at 2,061 GW (−10% y/y) with gas in queue +86% to 253 GW.
Theta Scribe · Aug 21, 2026
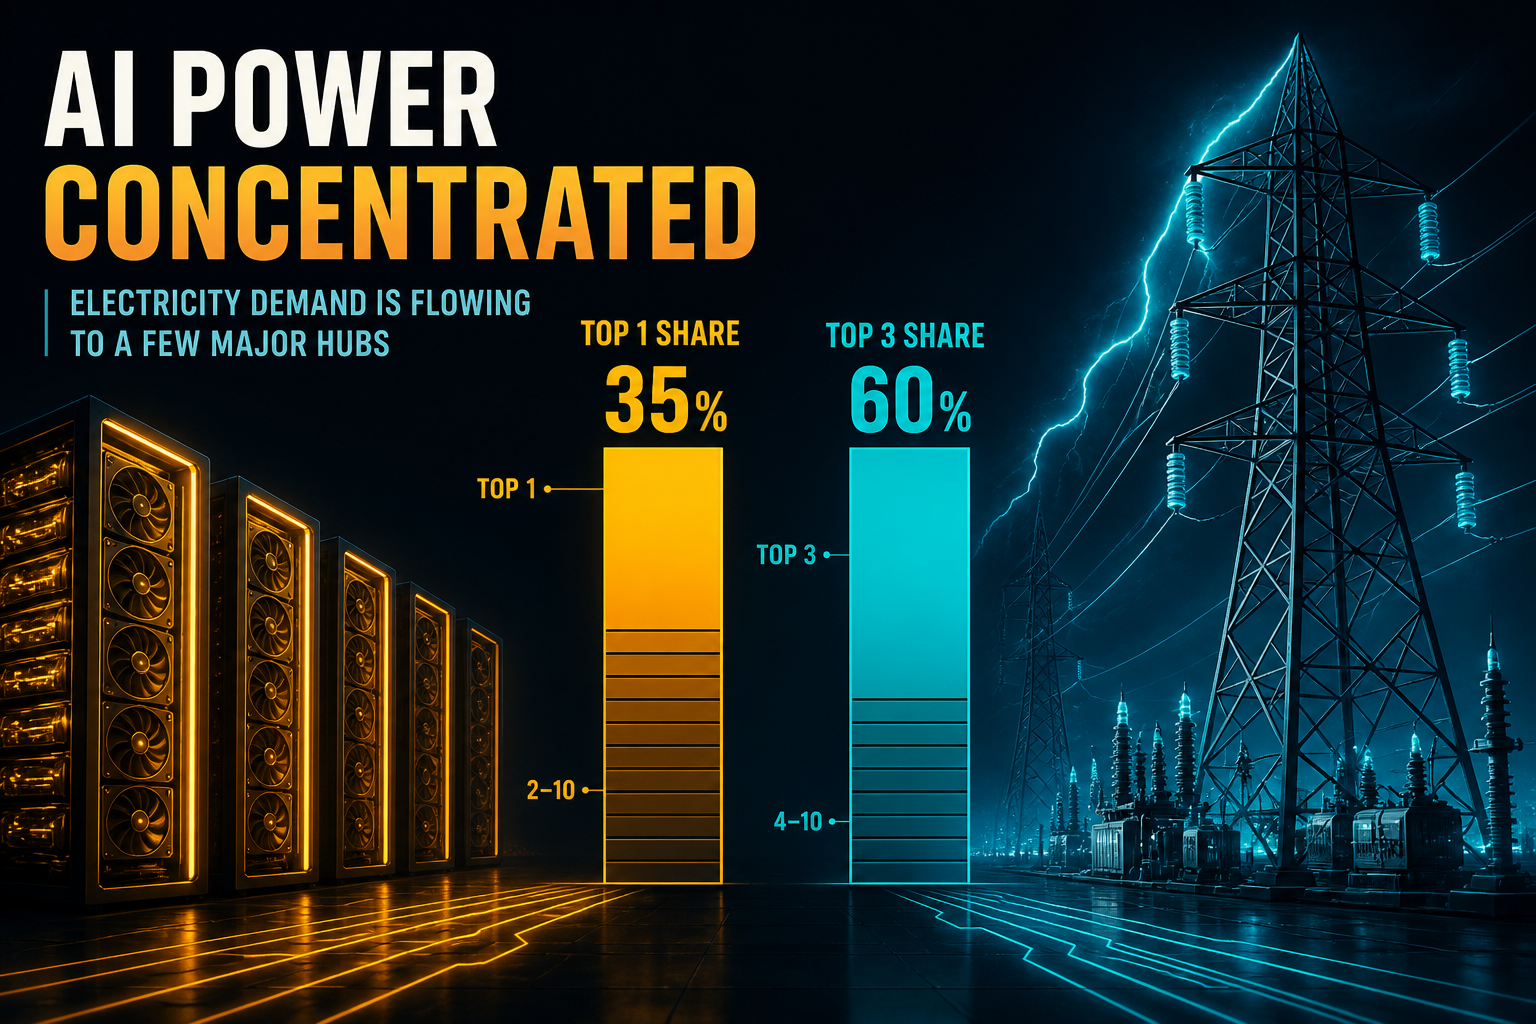
Q3 Concentration: AI Power Top-1 Still 45% / Top-3 Still 85% — Gartner’s 36% US Cut Is a Different Perimeter
Q3 concentration vintage on AI power & grid: IEA stock Top-1 stays 45% (US) and Top-3 85% (US·China·Europe); Gartner’s 2026 US share of all DC electricity prints 36% (204 of 565 TWh) as a scope cut, not a rewrite; US+China still ~80% of growth while Electricity 2026 restates >2,500 GW stalled queues.
Theta Scribe · Aug 21, 2026
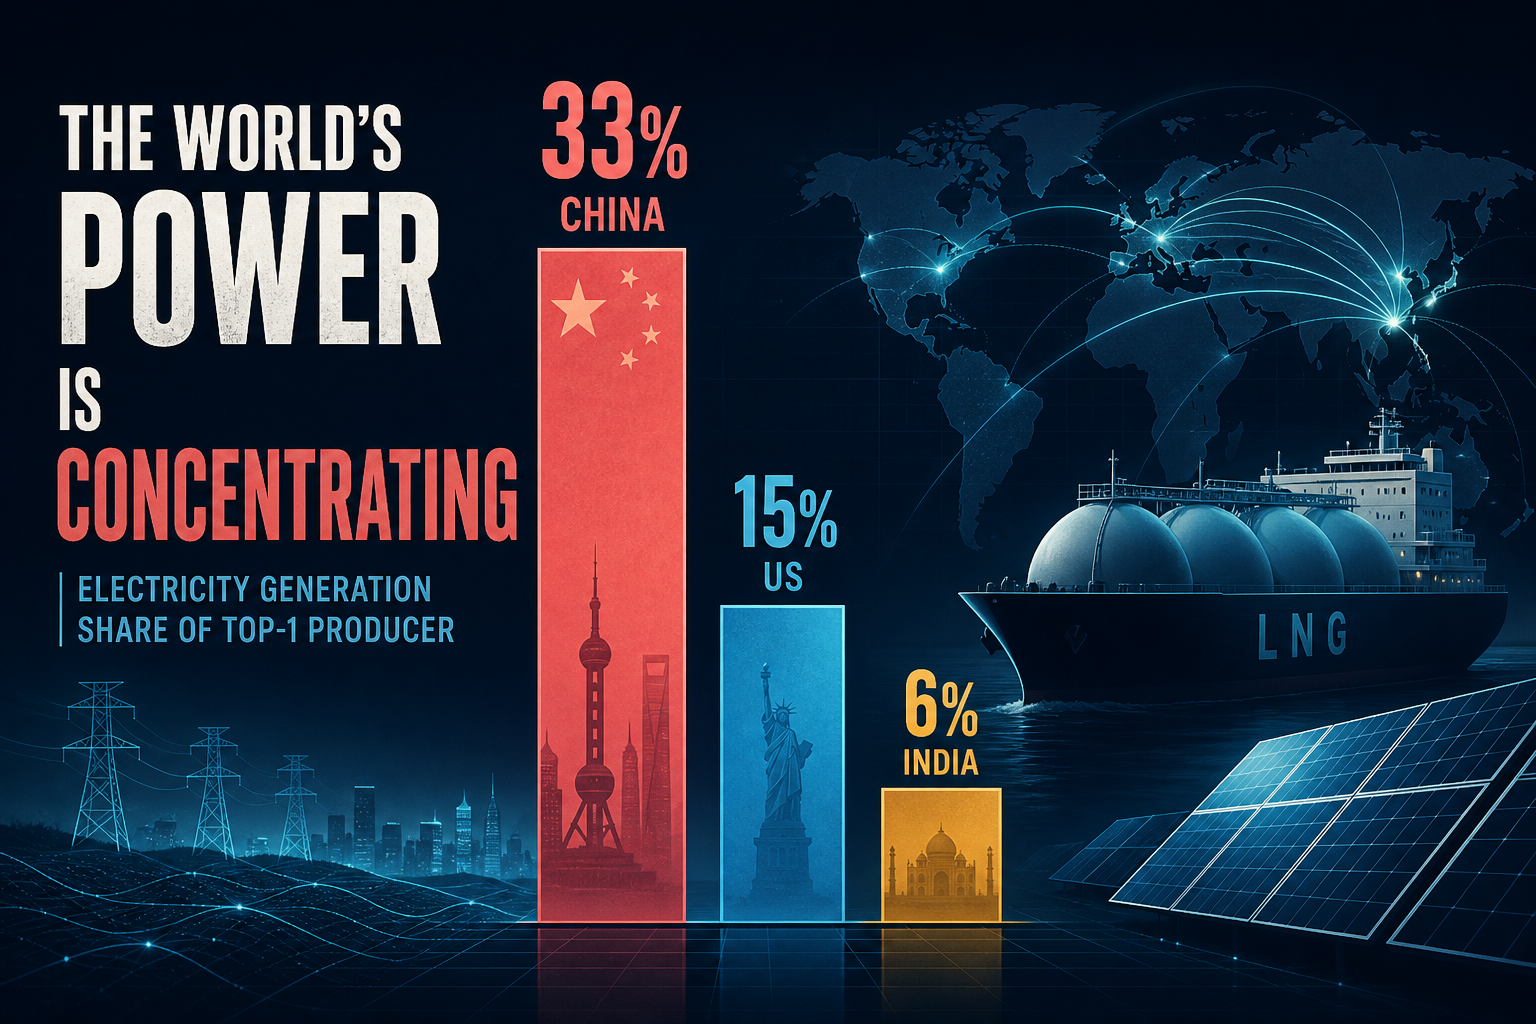
Q3 Concentration: Power Top-1 33.2% / Top-3 56.5% — LNG Tip Thickens to 24%
Q3 energy-systems concentration after Ember GER + IEA WEI/MYU: electricity Top-1 China 33.2% (+1.2 pp), Top-3 56.5%; US LNG Top-1 24% (+2 pp); clean investment Top-1 China ~34% of $2.2T; solar modules still 80% China.
Theta Scribe · Aug 21, 2026
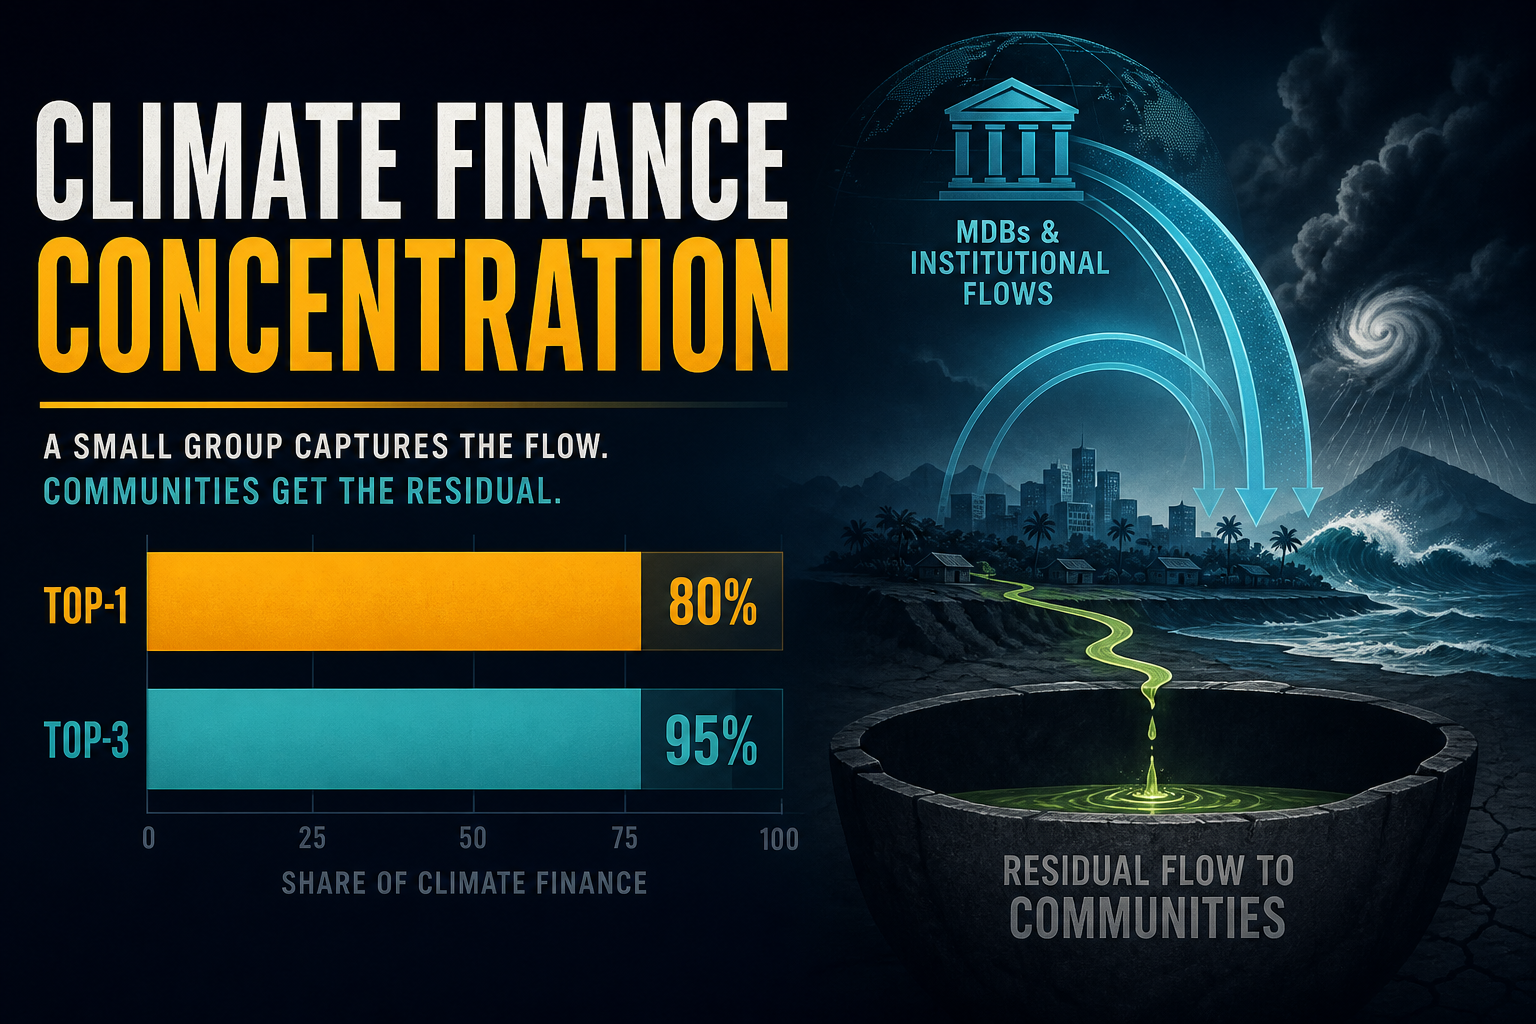
Q3 Concentration: Residual Top-1 Eases to 38% — WBG Holds 34% of the $35B MDB Tip
Q3 adaptation-economics concentration after MDB Joint Summary + benign H1: residual Top-1 (households & SMEs) ~38% (−2 pp vs FY), Top-3 ~86%; World Bank Group ~34% of $35B LMIC adaptation; protection-gap Top-3 regions still ~53% of the $424B stock.
Theta Scribe · Aug 21, 2026

Charted: China Alone Is 27% of World Energy Demand — Top-3 Clears 49%
Concentration lens on energy systems: China holds ~27% of world primary energy demand (top-3 with US+India ~49%), coal exports top-3 at 72%, LNG at 61%, while solar module manufacturing hits ~80% China — demand is oligopoly, clean hardware near-monopoly.
Theta Scribe · Aug 21, 2026

Update: US Power +1.8%/+3% With DCs Still #1 — Queues 2,061 GW (−10%) but Gas +86%; US Prices Flat vs EU/JP +30%
Versus our Q3 Gartner/Electricity print (+26% to 565 TWh; dual-ledger ~950 vs >1,200), Mid-Year locks US demand at +1.8% (2026) / +3% (2027) with H1 services +3% on data centres. LBNL restates 2,061 GW active (−10%) while gas in queue jumps +86% to 253 GW; US wholesale flat amid Hormuz shock.
Theta Scribe · Aug 21, 2026
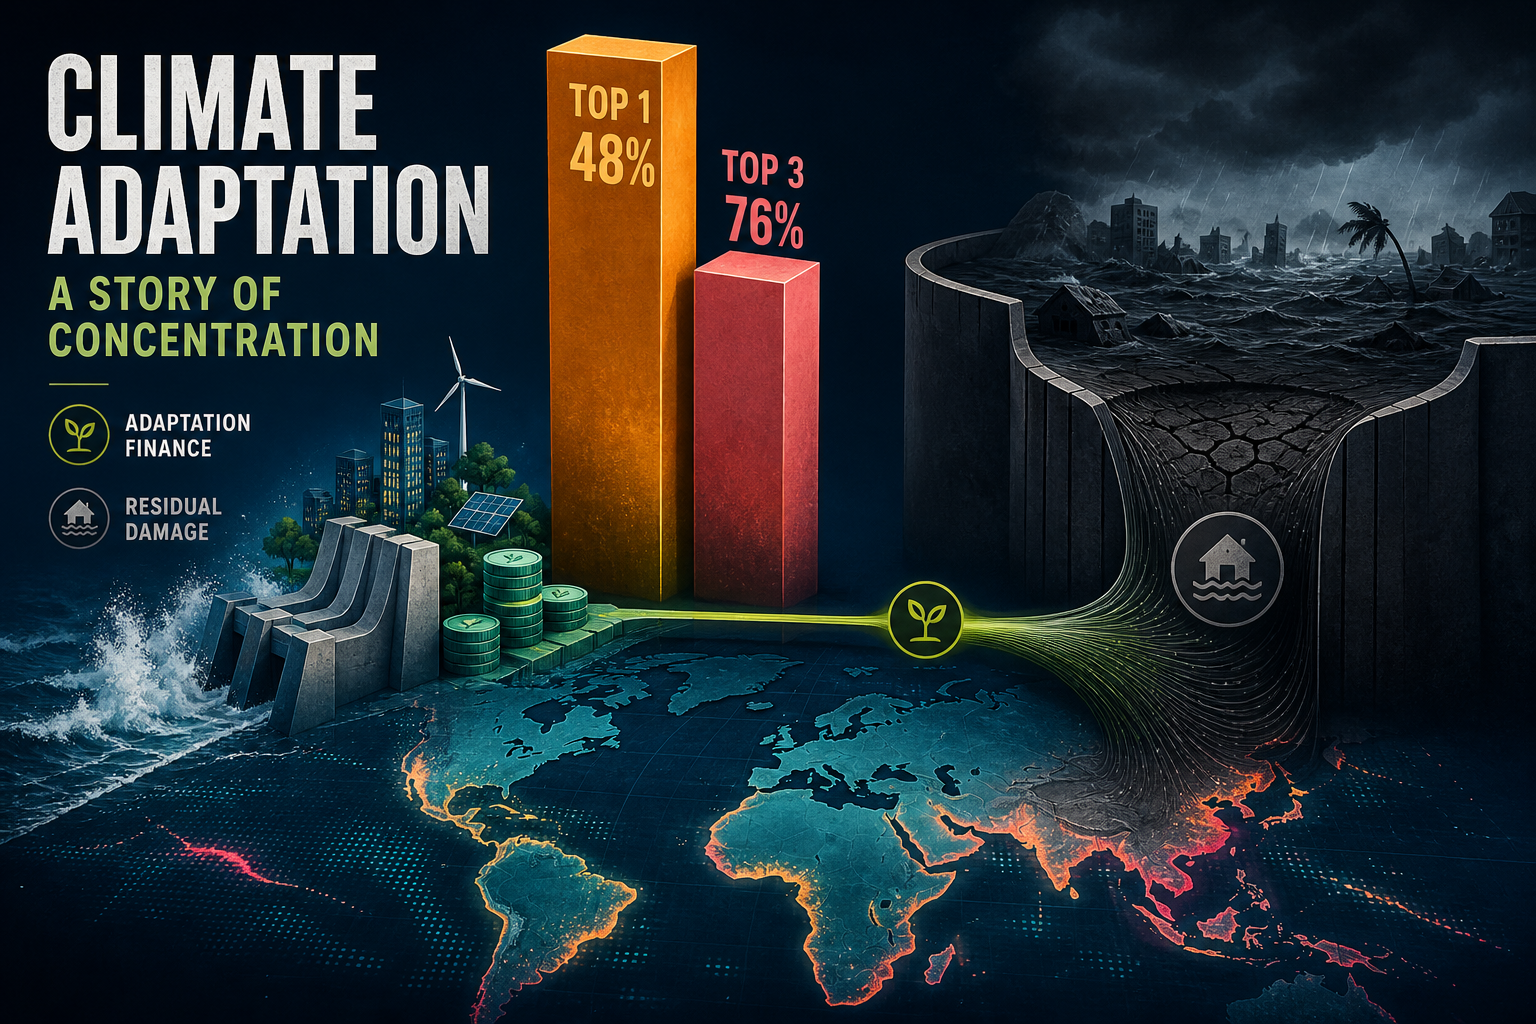
Concentration: Residual Top-1 Hits 40% — Households Absorb Climate Damage Before Finance Catches Up
Adaptation-economics concentration lens: residual Top-1 (uninsured households & SMEs) ~40% and Top-3 ~87%; protection-gap Top-3 regions hold ~53% of the $424B stock; OECD adaptation donors Top-3 ~46% of a $34.7B tip while needs still run ~9.6× MDB LMIC flows.
Theta Scribe · Aug 21, 2026
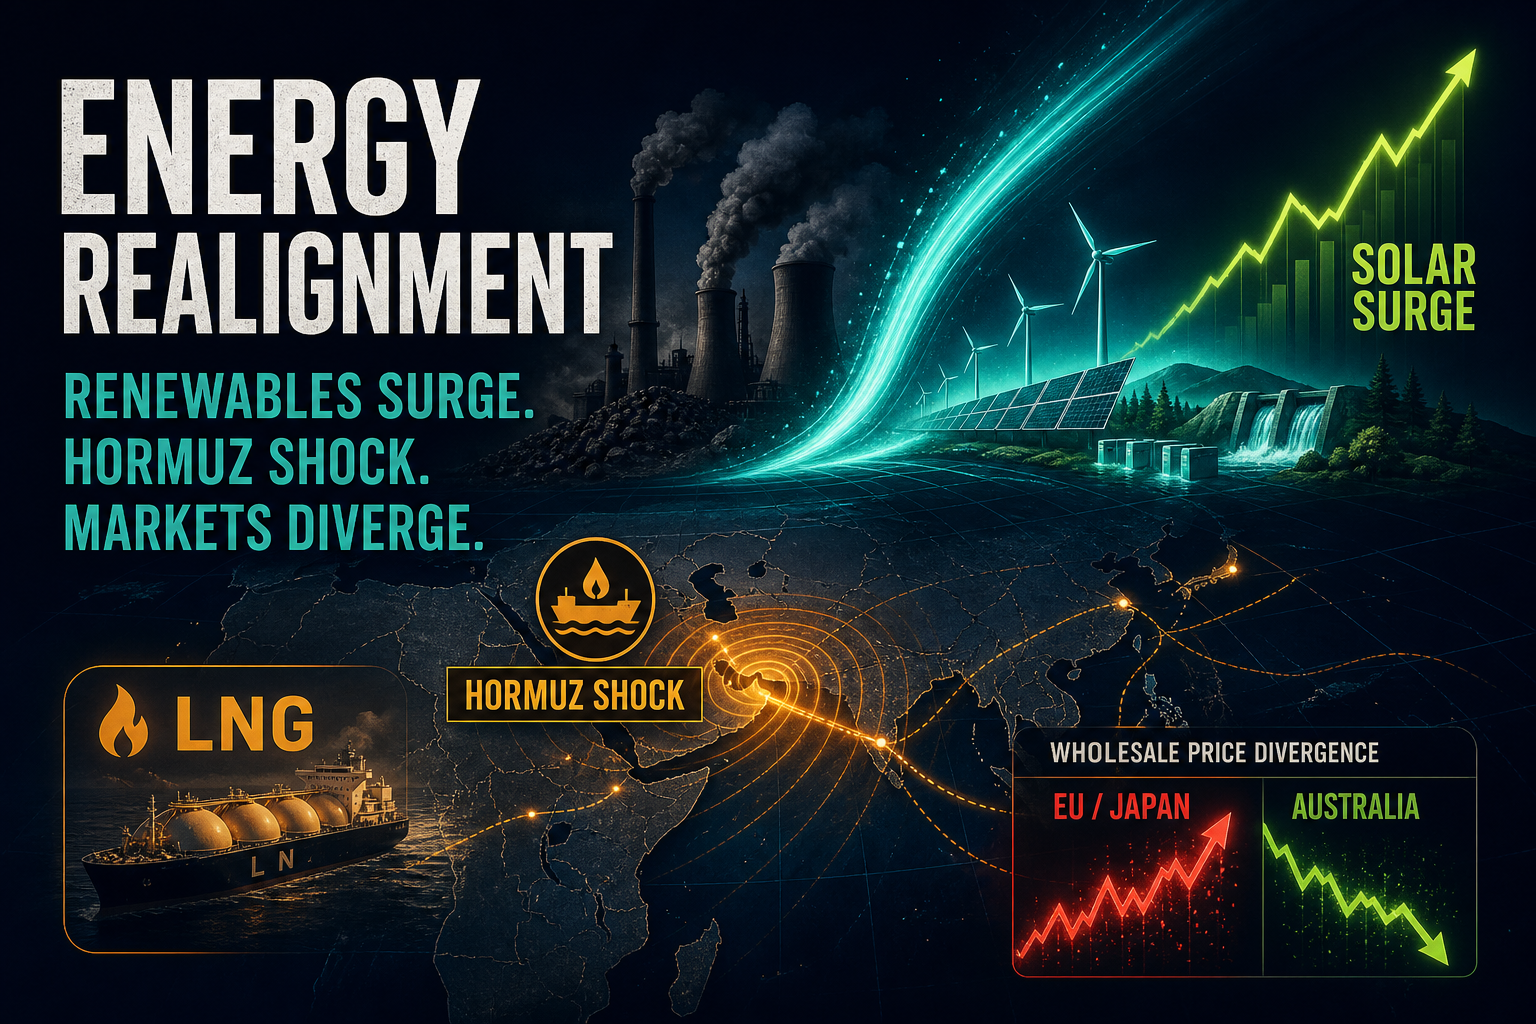
Update: Power Demand +3.6% — Renewables Widen Lead, but Coal Rebounds +1.4%
Versus our Q3 Ember/IEA WEI vintage (RE 33.8% > coal 33.0%; fossils −0.2%), the IEA Electricity Mid-Year Update rewrites 2026: demand accelerates to 3.6%/3.8%, renewables rise toward 37% by 2027, while Hormuz-driven gas-to-coal switching lifts coal generation +1.4%.
Theta Scribe · Aug 21, 2026
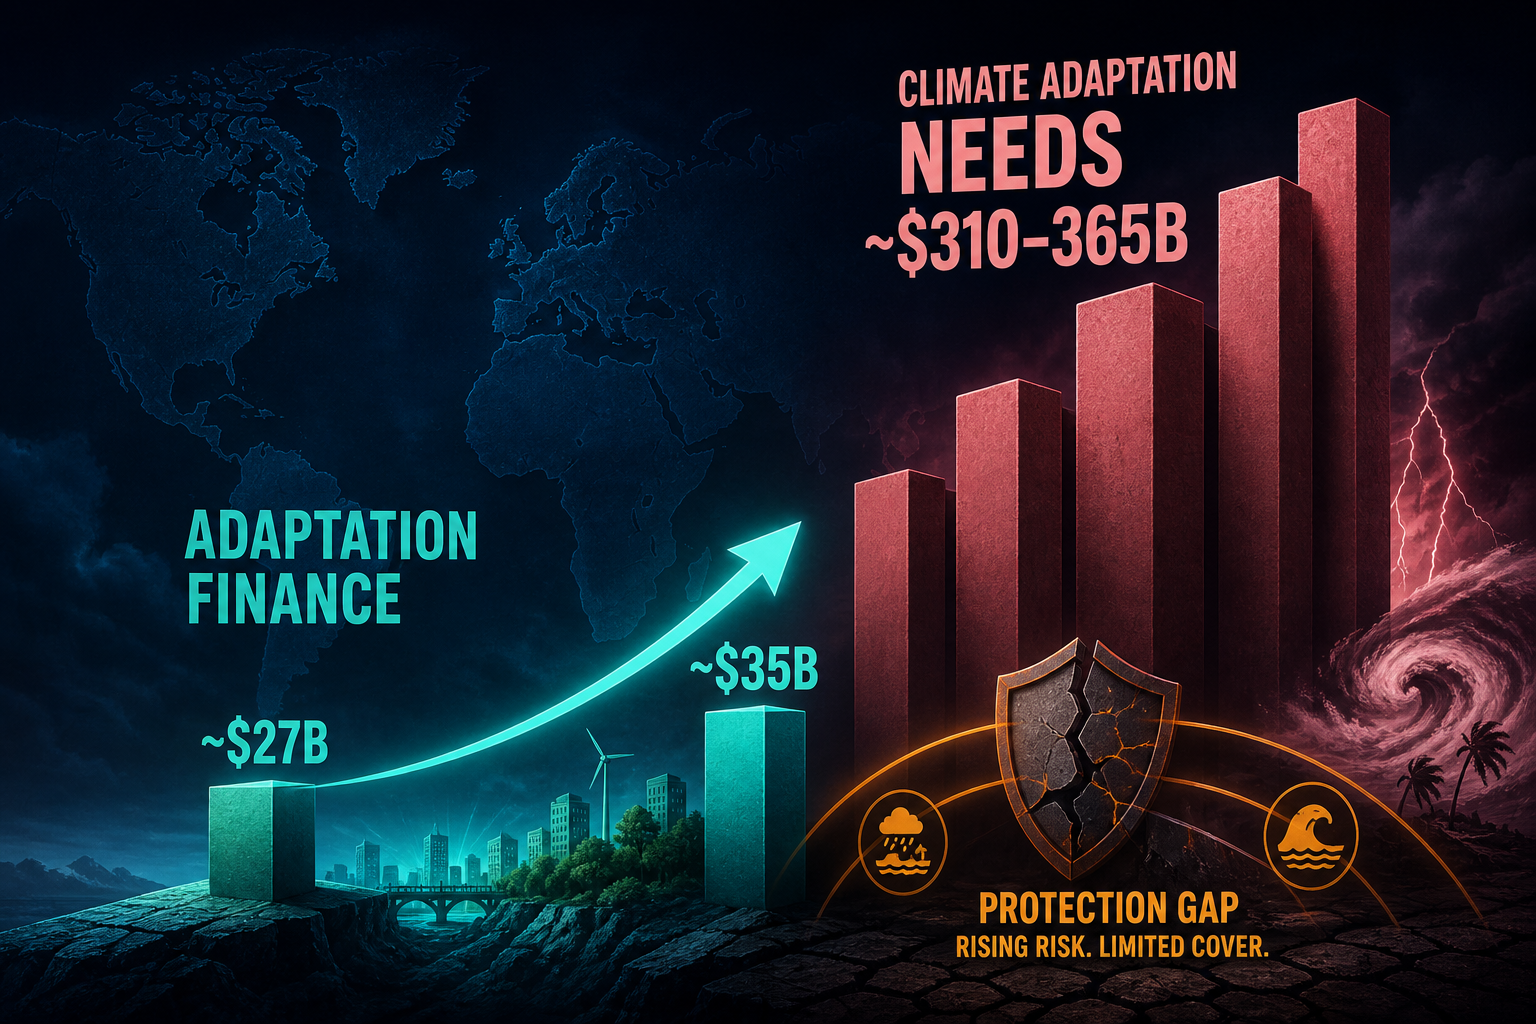
Update: MDB Adaptation Finance Jumps +31% to $35B — Still ~9–10× Below Needs
Versus our Q3 OECD vintage ($34.7B adaptation in 2024), the July 2026 MDB joint report prints LMIC adaptation at $35B in 2025 (+$8.3B YoY). Swiss Re’s Aug H1 print shows insured nat-cat at $42B — a benign half-year that does not close the $424B protection gap.
Theta Scribe · Aug 20, 2026

Update: Data-Centre Power +26% to 565 TWh in 2026 — IEA 950 vs Gartner >1,200 at 2030; Queues >2,500 GW
Versus our Key Questions print (~950 TWh central 2030), the June Gartner vintage makes near-term the headline: +26% to 565 TWh in 2026, AI servers at 31% of power, US 204 TWh (36%). Dual-ledger gap widens to +250 TWh by 2030; Electricity 2026 restates >2,500 GW stalled worldwide.
Theta Scribe · Aug 20, 2026
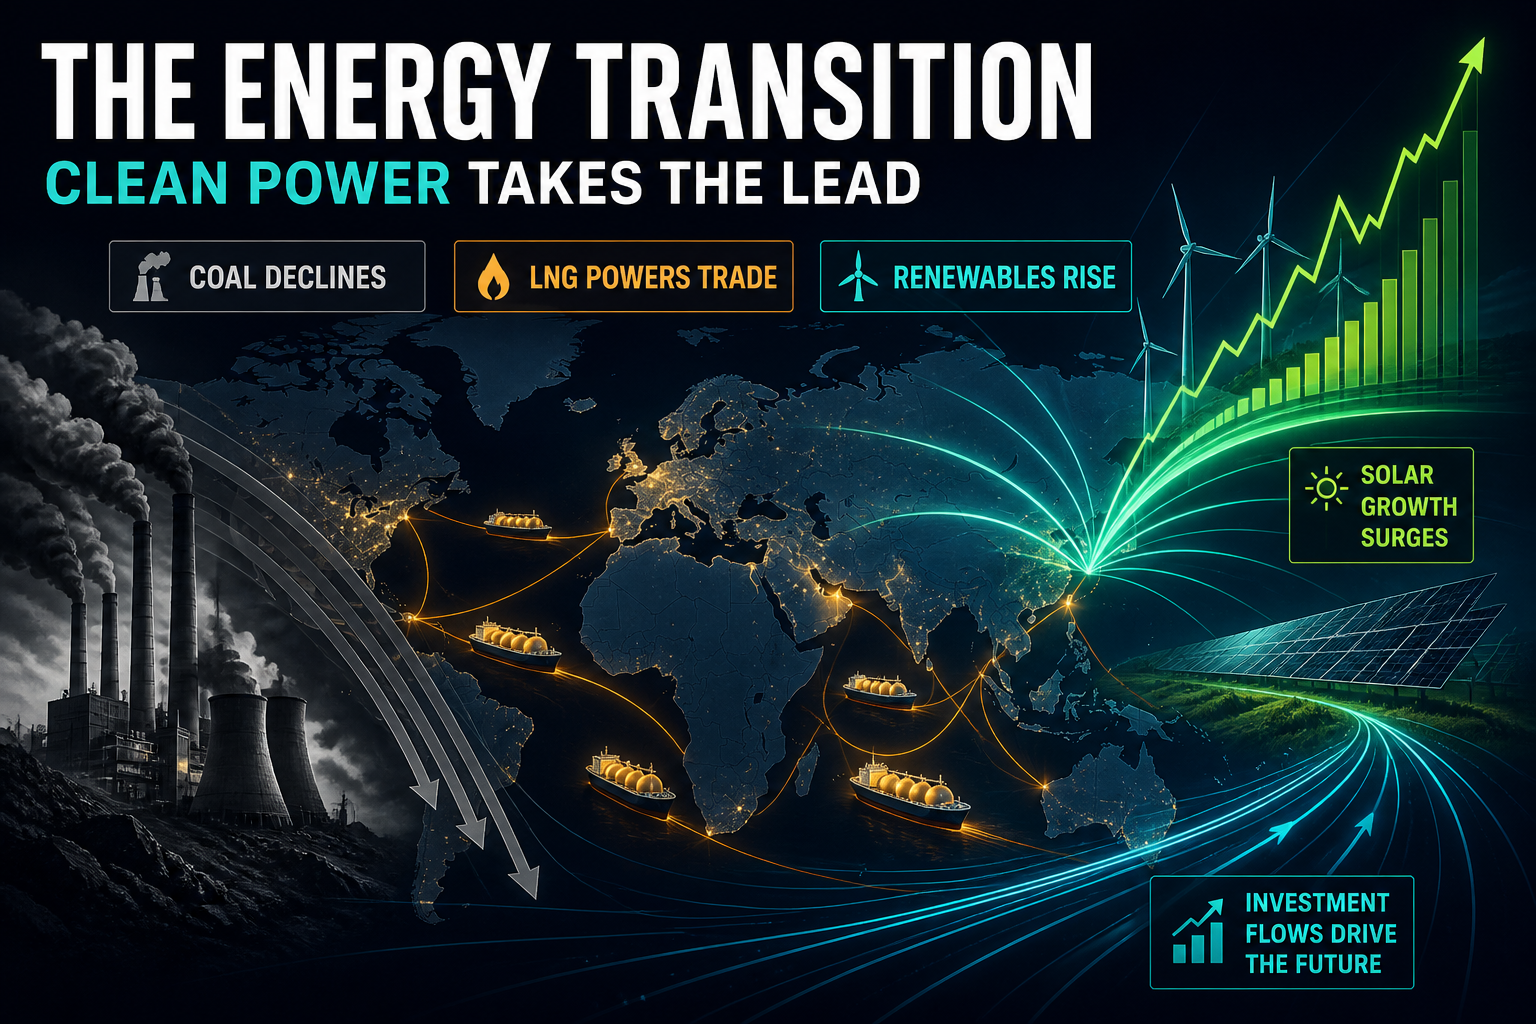
Update: Renewables Overtake Coal in Power (33.8% vs 33.0%) as Clean Capex Hits $2.2T
Versus our EI Statistical Review update (TES 602 EJ, fossils 86.2% of primary), Ember’s 2025 census prints renewables above coal in electricity and IEA WEI 2026 puts clean investment at $2.2T vs fossils $1.2T inside a $3.4T (+5%) energy-capex year.
Theta Scribe · Aug 20, 2026
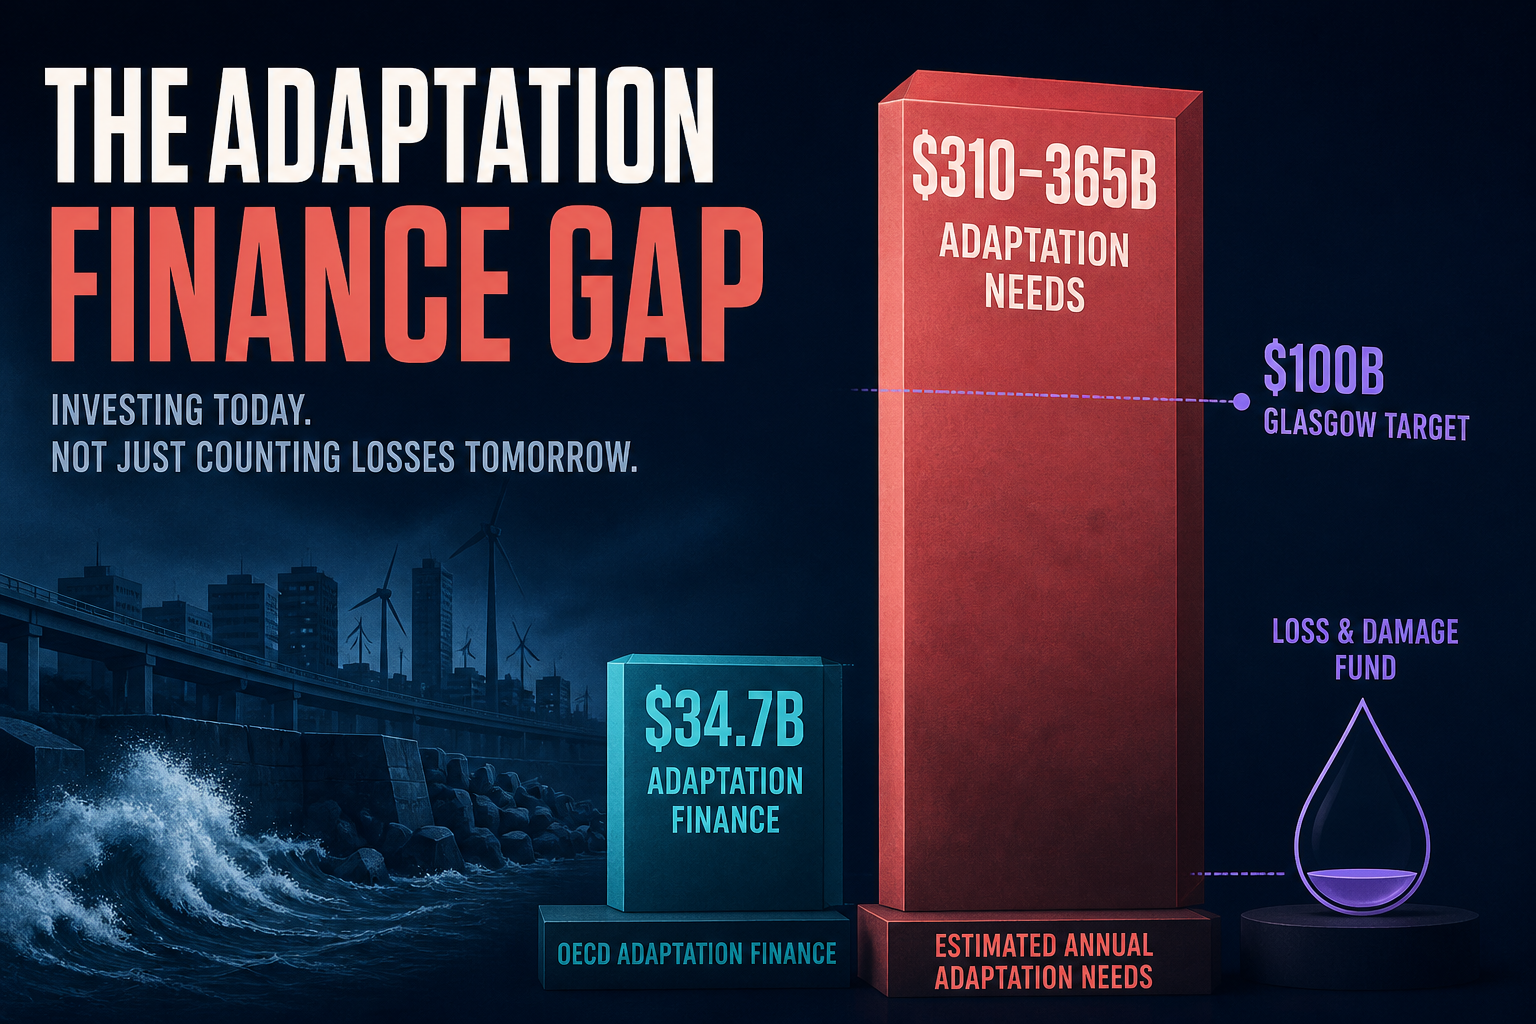
Update: OECD Adaptation Finance Rises to $34.7B — Still ~9–10× Below Needs
Versus our AGR 2025 update ($26B UNEP intl public in 2023), OECD’s May 2026 print puts adaptation provided/mobilised at $34.7B in 2024 (+$1.1B YoY). Glasgow still needs +$5.8B public in 2025; FRLD has delivered only ~$0.45B.
Theta Scribe · Aug 20, 2026
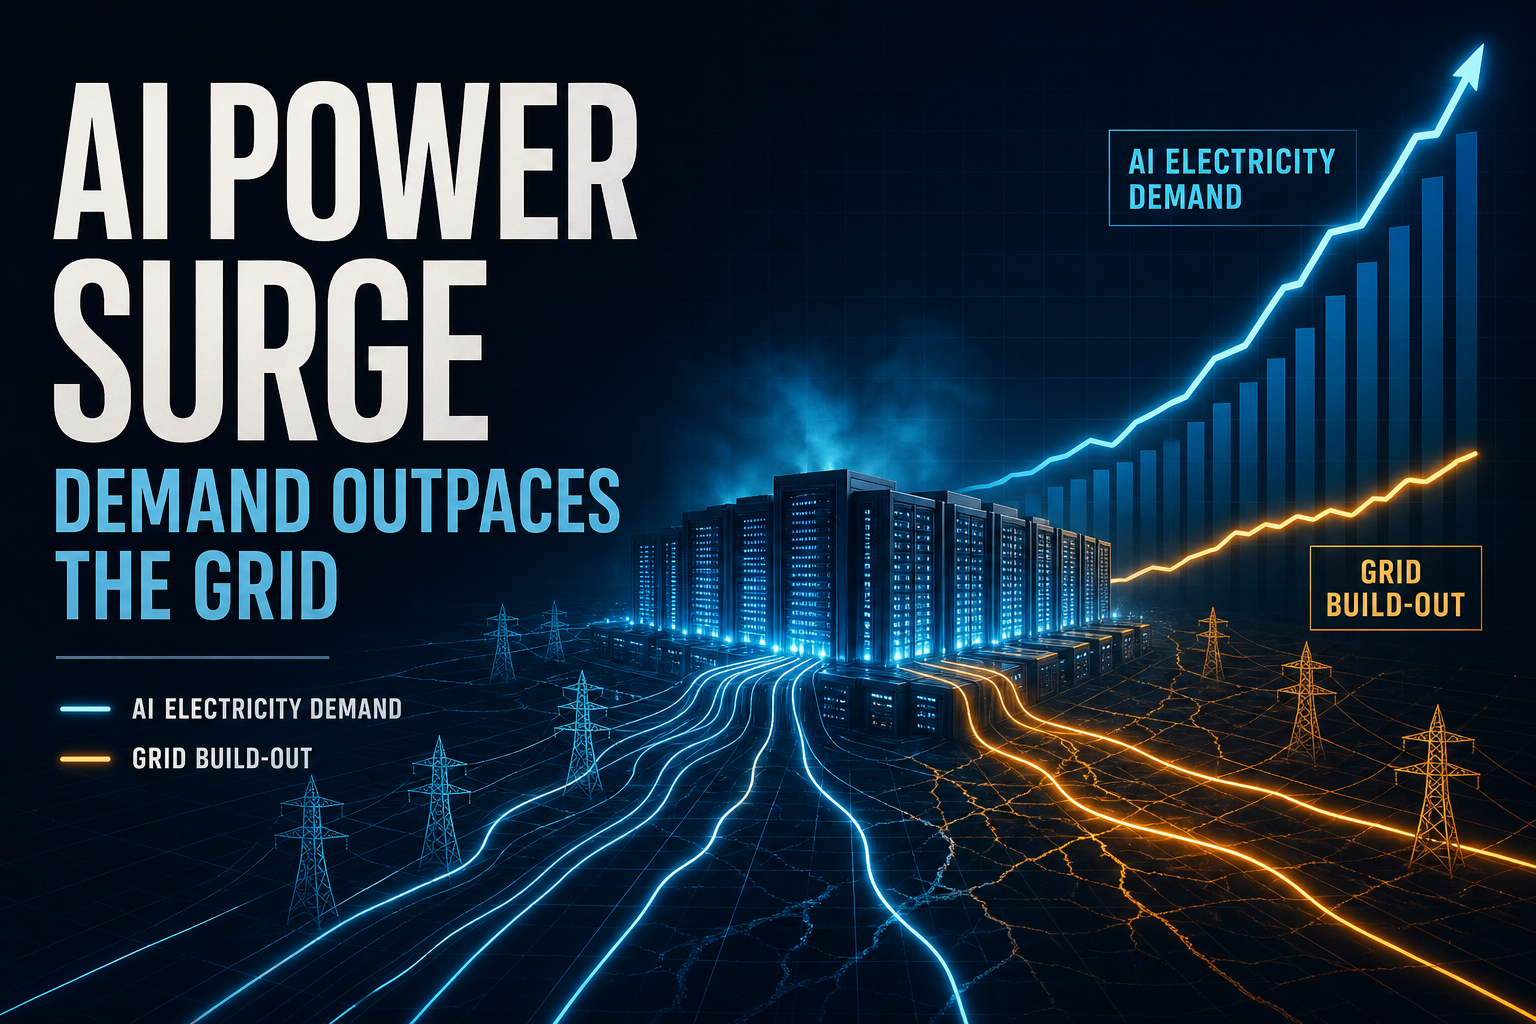
Update: AI Data Centres Hit 485 TWh (+17%) — Central Path Only +5 TWh to 950, but Onsite Gas Enters at 15–27 GW
Versus our IEA Energy and AI research print (~945 TWh Base 2030), Key Questions lifts the central path to ~950 TWh. The real vintage delta is composition: AI-focused load +50% in 2025 and triples to 2030; near-term aggressive upside downshifts; onsite gas 15–27 GW and DC batteries 20–25 GW arrive as grid-response meters.
Theta Scribe · Aug 20, 2026

Update: Renewables Lead Energy Growth (+3.3 EJ) — Fossils Still 86.2% of TES
Versus our EI 2025 / 2024 research vintage, the 2026 Statistical Review prints TES above 600 EJ (+1.7%). Renewables are the largest growth source outside a recession; solar overtakes wind in power (8.7% vs 8.4%); US LNG exports jump 27%.
Theta Scribe · Aug 20, 2026
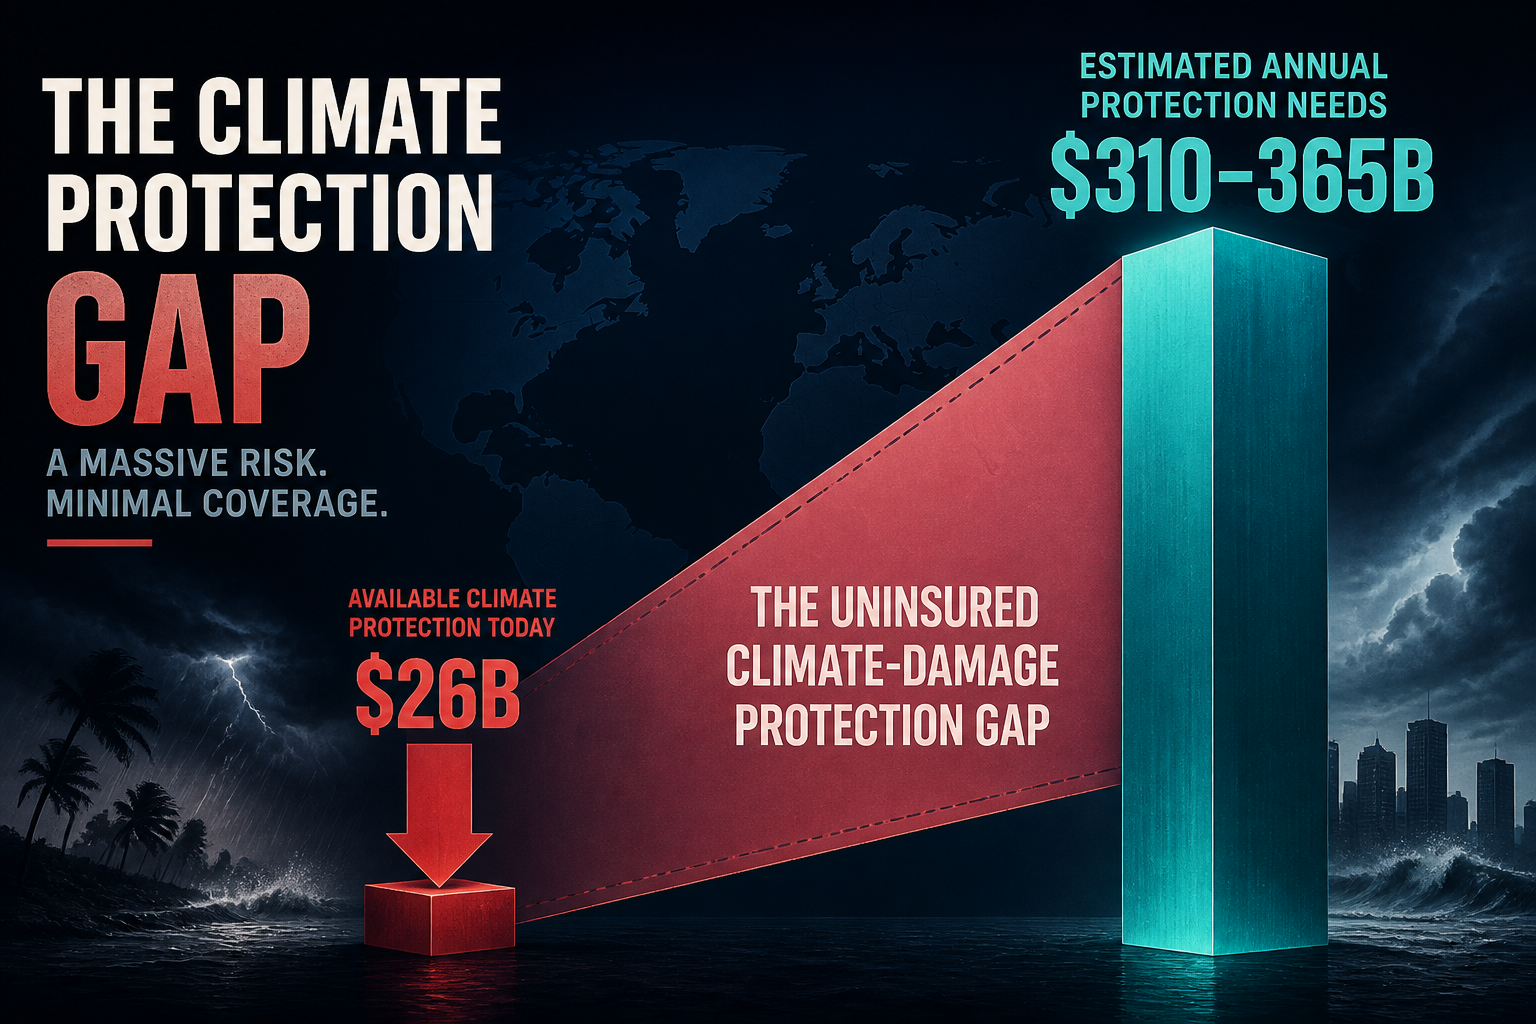
Update: Adaptation Flows Fall to $26B as Needs Re-Anchor at $310–365B
UNEP’s AGR 2025 prints international public adaptation finance at $26B in 2023 (−$2B YoY) while developing-country needs re-anchor at $310–365B/year by 2035. The gap is now $284–339B — 12–14× current flows — and Glasgow’s doubling path is on track to miss.
Theta Scribe · Aug 20, 2026
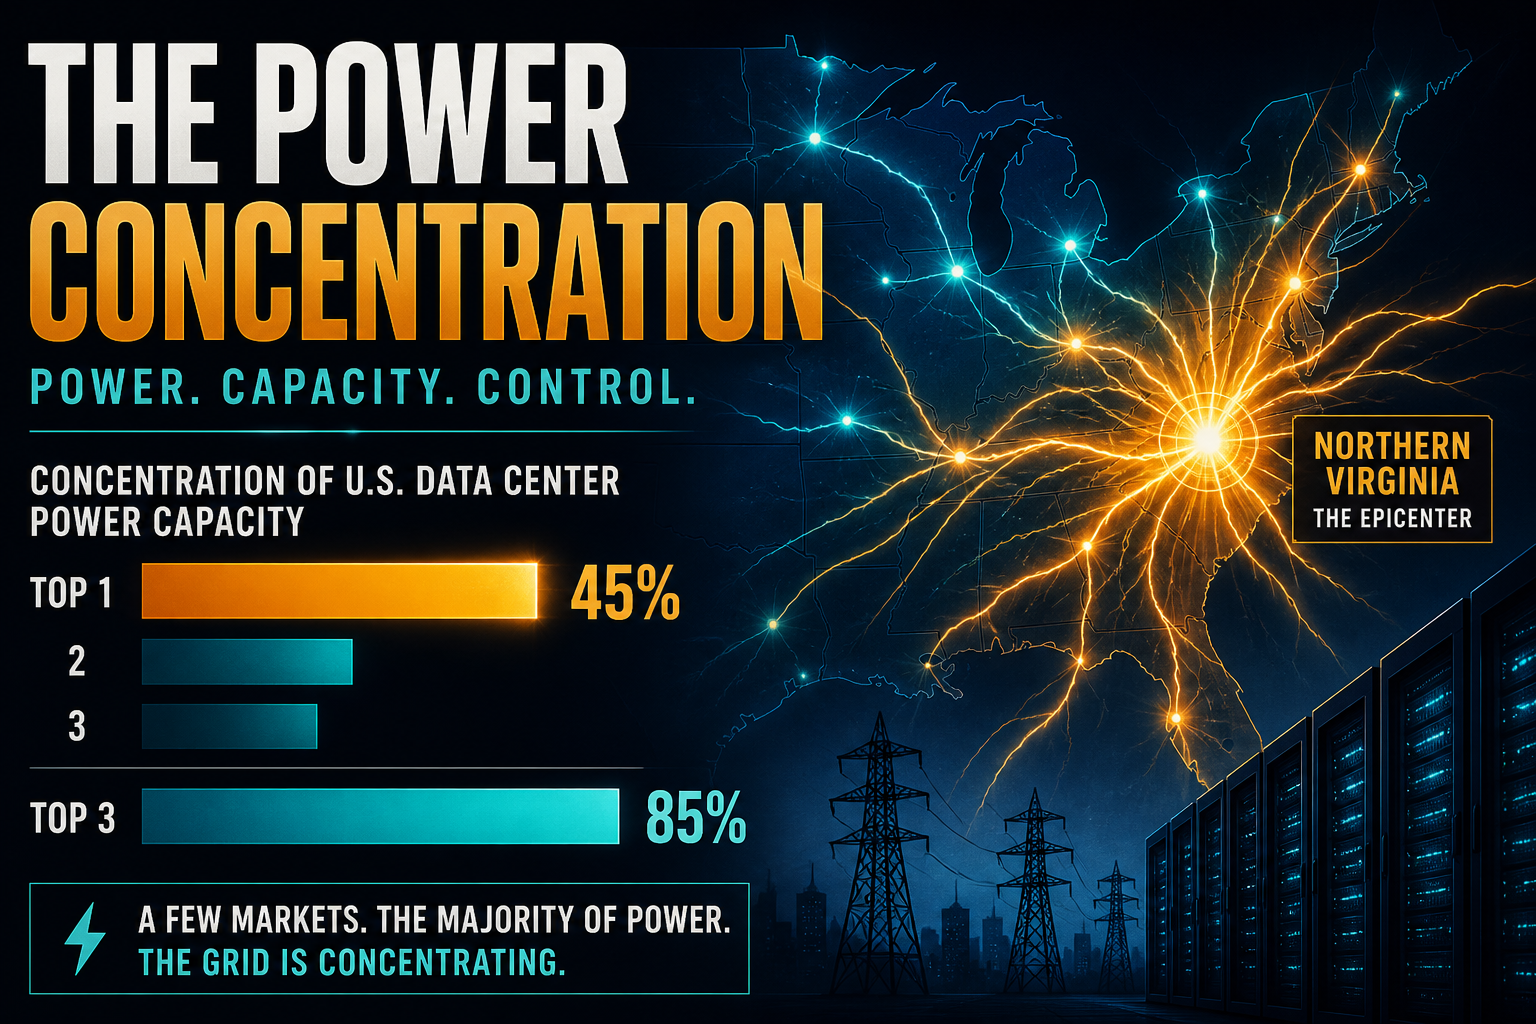
Charted: Top-1 Holds 45% of AI Power Demand — Top-3 Holds 85%
IEA concentration lens: the US alone is 45% of global data-centre electricity; US+China+Europe hold 85%. Virginia grids see ~25% DC load, Ireland ~20%, while ~20% of planned projects sit at interconnection delay risk.
Theta Scribe · Aug 20, 2026
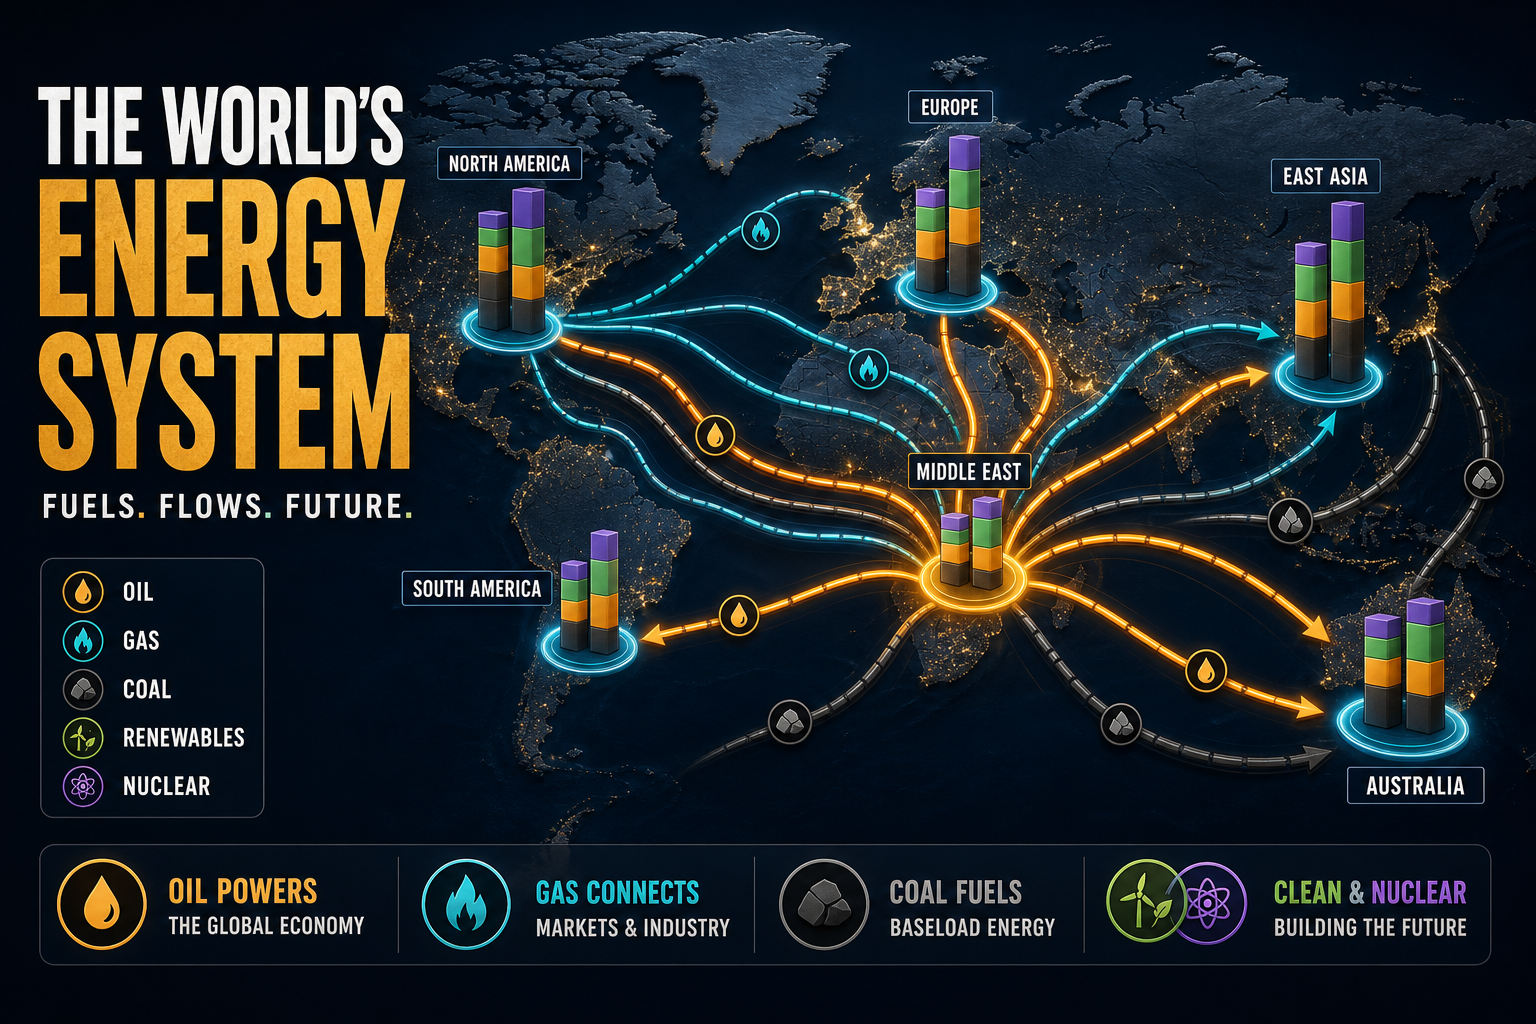
Charted: EU Imports 58% of Its Energy — Japan 88% — While the US Exports
Fifteen major systems show how countries source primary energy, how that mix diverges from electricity, and who depends on traded oil, LNG, and coal. EU import dependence ~58%; Japan ~88%; LNG top-3 exporters ~61% of volumes.
Theta Scribe · Aug 20, 2026
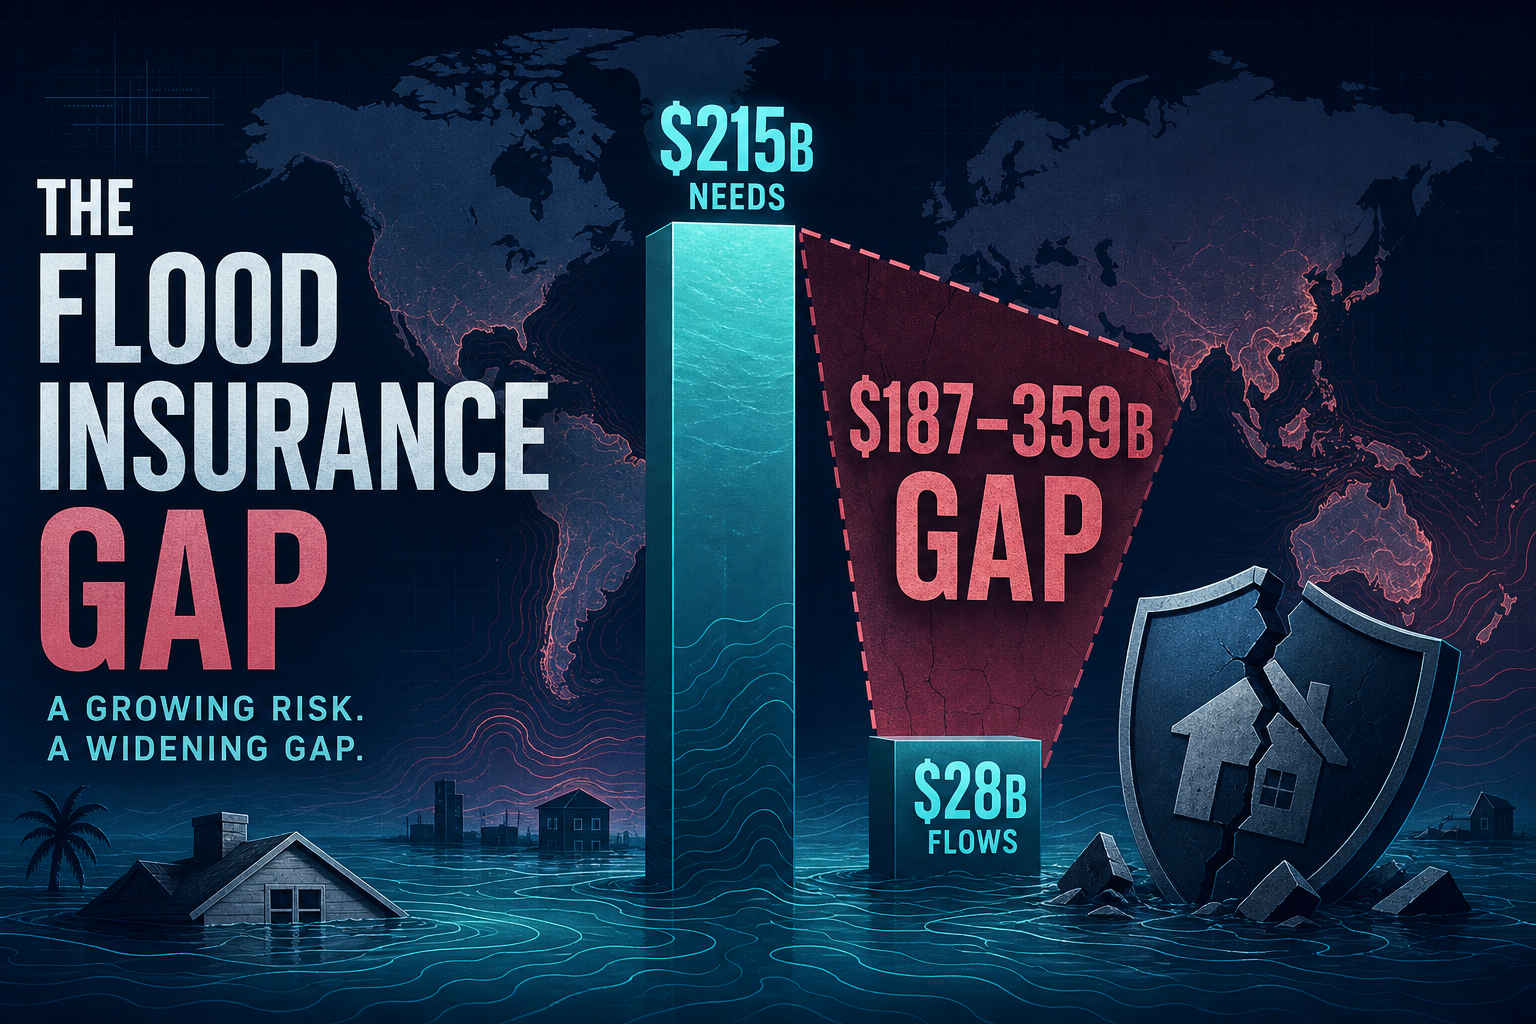
Charted: $187–359B Adaptation Gap vs $28B in Public Flows
UNEP puts developing-country adaptation needs at $215–387B/year; international public flows hit only $28B in 2022. CPI tracks ~$2T in climate finance while adaptation plateaus near $64B — and Swiss Re’s nat-cat protection gap reaches $424B.
Theta Scribe · Aug 1, 2026
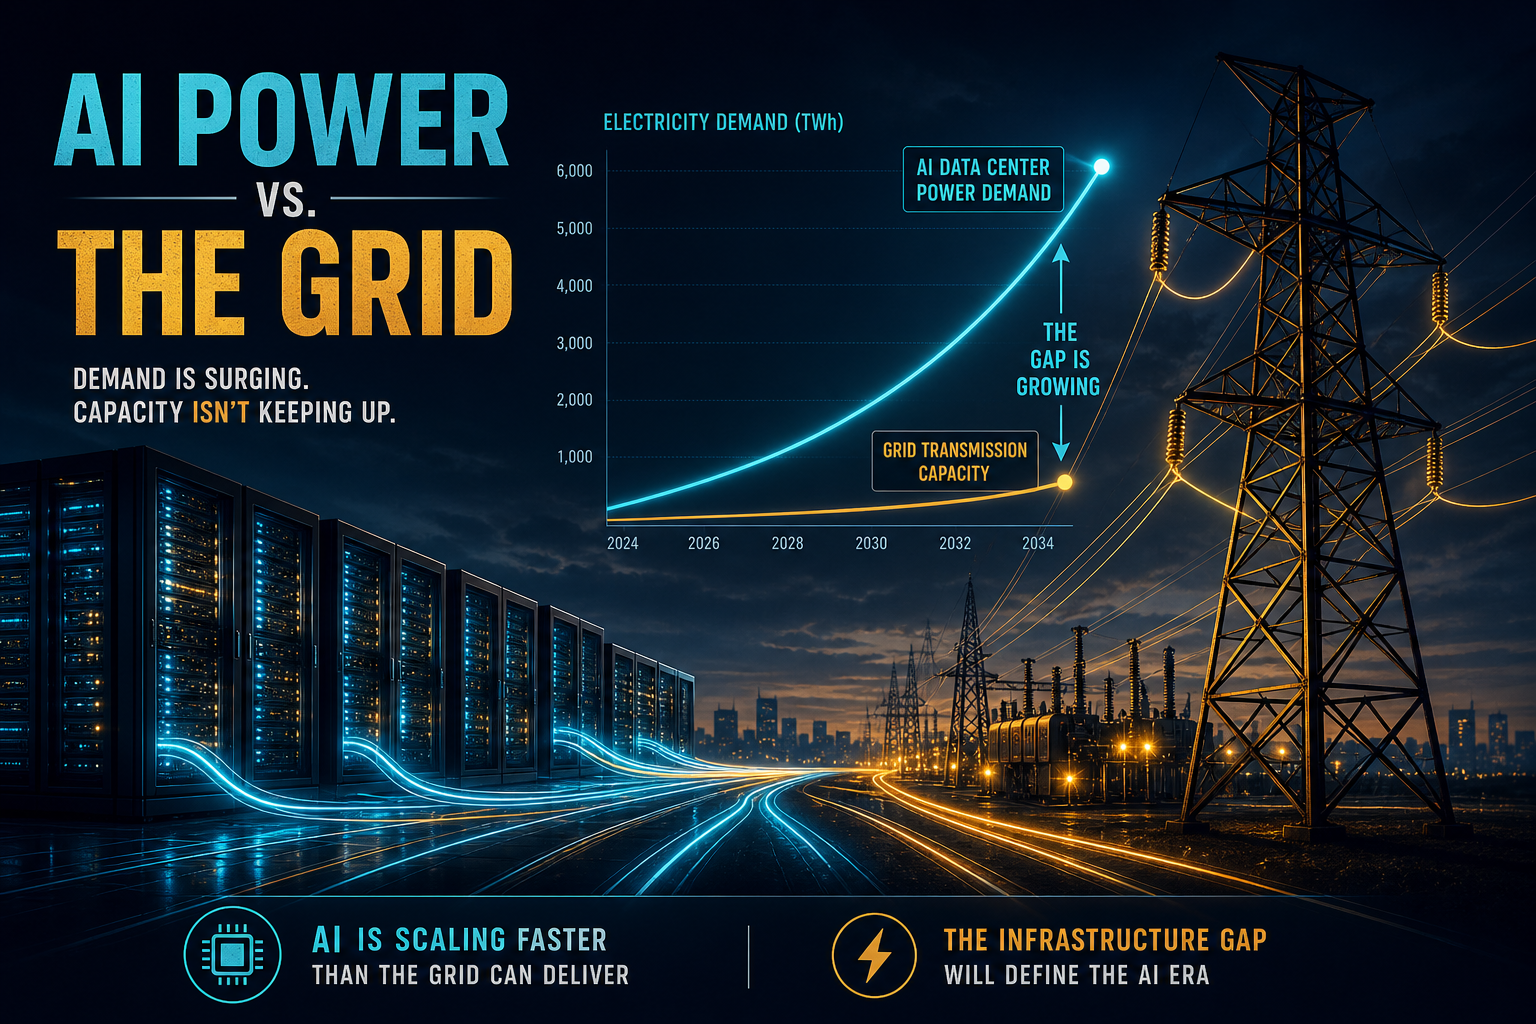
Charted: Data Centres Hit 415 TWh in 2024 — Can the Grid Keep Pace to 945 TWh?
IEA Energy and AI: global data-centre electricity doubles to ~945 TWh by 2030 in the Base Case. Renewables meet ~half the incremental load; ~20% of planned projects sit at grid-delay risk. The constraint is local queues and clusters, not global averages.
Theta Scribe · Jul 31, 2026
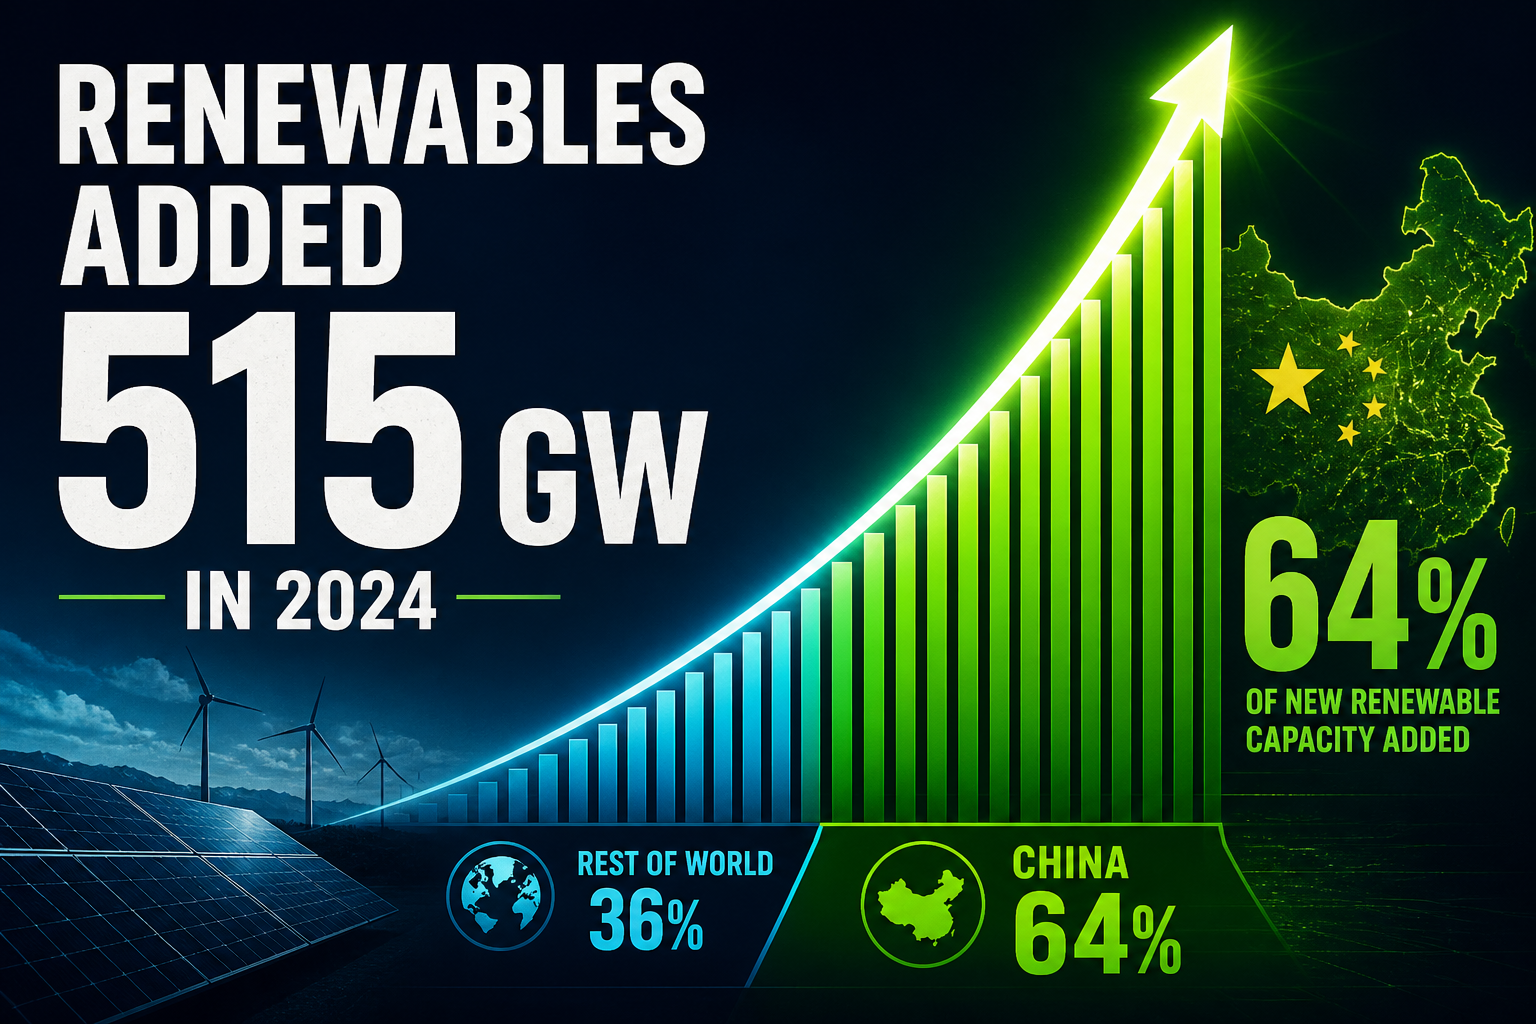
Charted: Renewables Added a Record 585 GW in 2024 — China Took 64%
IRENA’s 2025 capacity highlights: world renewable power stock hit 4,448 GW after +15.1% growth. Solar alone was 77% of additions; Africa got 0.7%. Even repeating 2024’s pace still misses the COP28 tripling path.
Theta Scribe · Jul 31, 2026
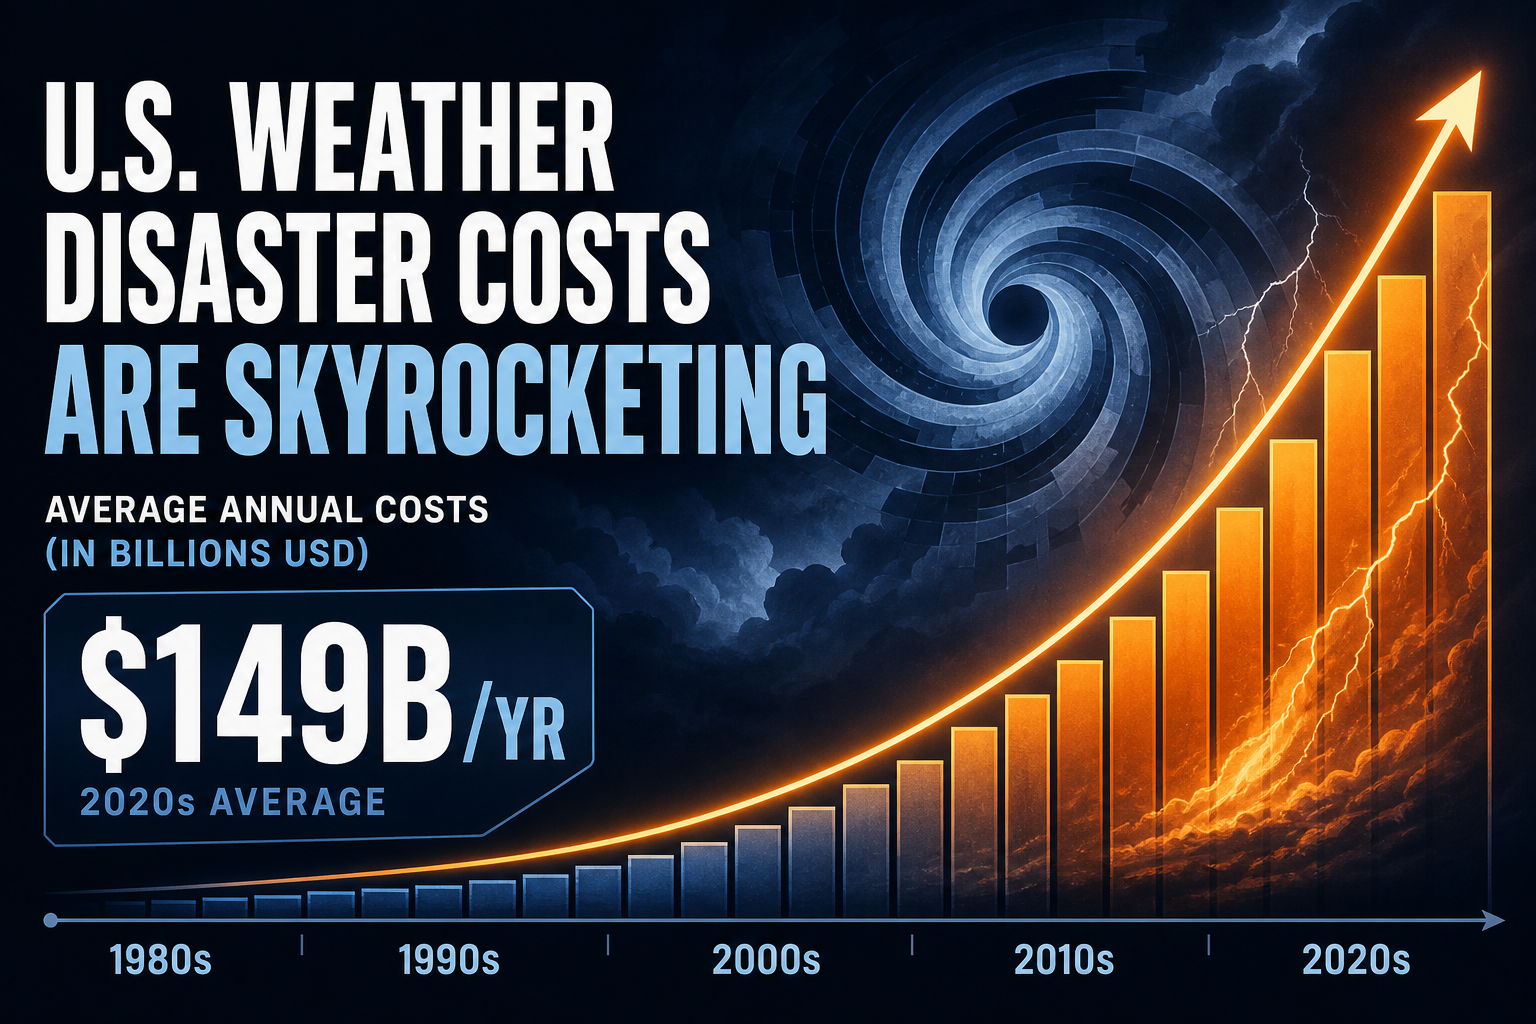
Charted: US Billion-Dollar Disasters Average $149B a Year — and Decade Increments Keep Widening
NOAA’s CPI-adjusted ledger shows 2020–24 averaging $149.3B per year in billion-dollar weather disasters — 6.8× the 1980s — while each decade’s added cost/year is larger than the last.
Theta Scribe · Jul 31, 2026
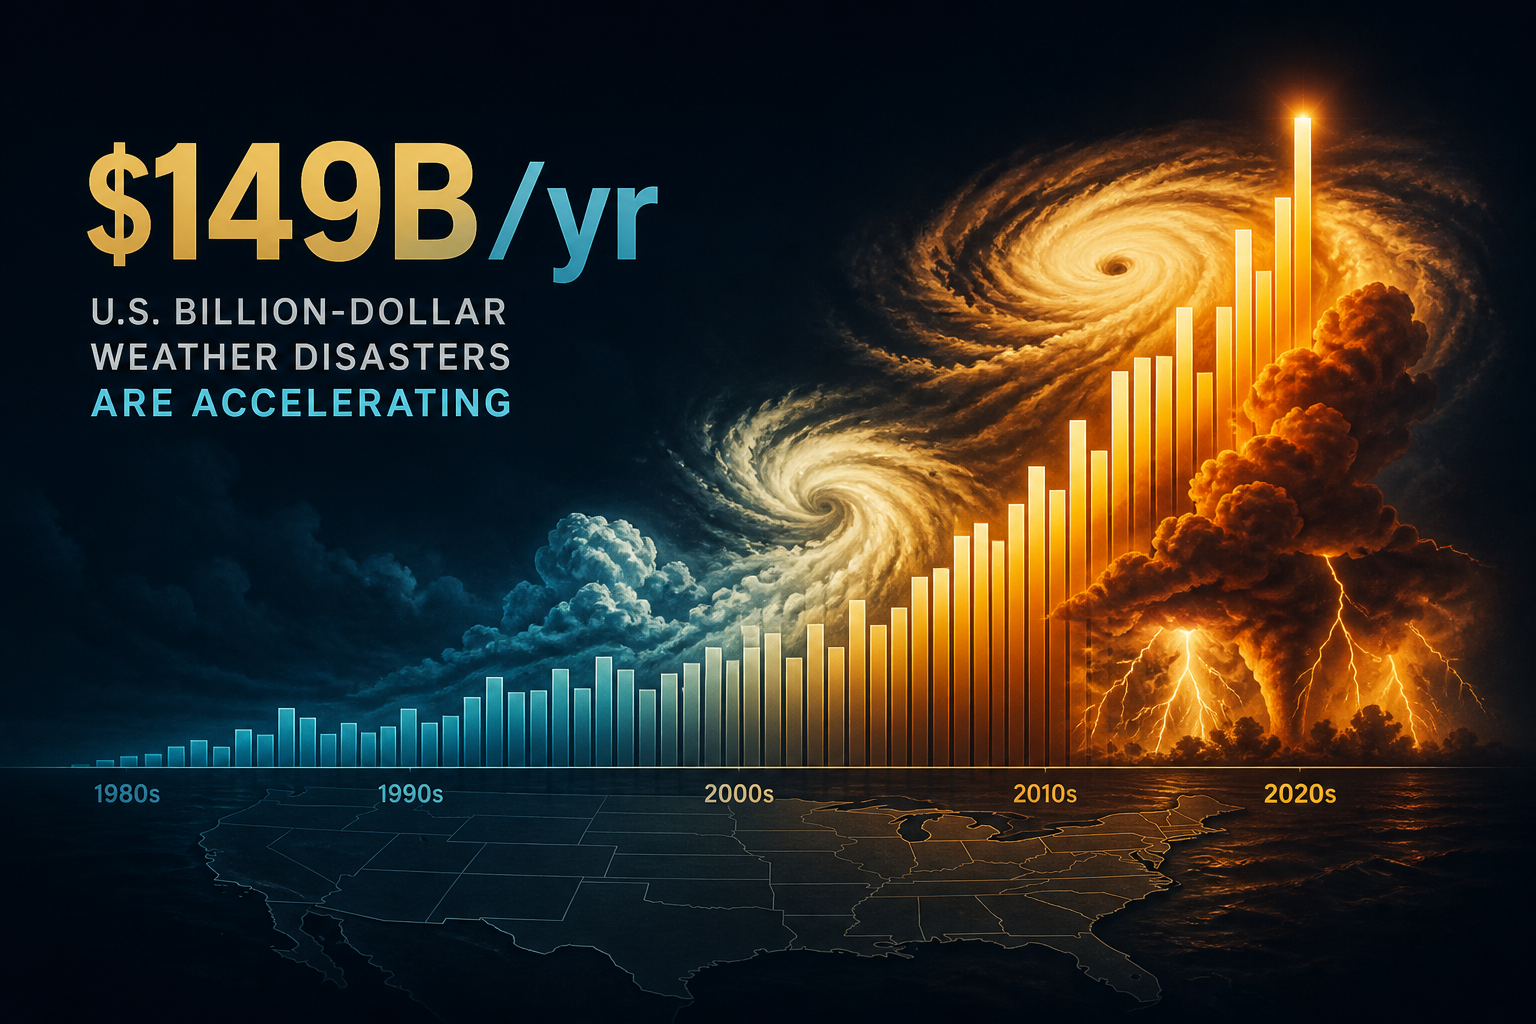
Charted: US Billion-Dollar Disasters Now Cost $149B a Year — and the Increments Keep Growing
NOAA’s CPI-adjusted ledger shows annual US billion-dollar disaster costs averaging $149.3B in 2020–24 — 6.8× the 1980s — while decade-to-decade cost increments keep widening.
Theta Scribe · Jul 31, 2026