
Research desk
Industry
34 original visual essays in this beat — each with its own figure and sourced argument, not a sequel of the last chart.

Ohio & Mississippi Locks: Mid-Age Chambers Out-Delay the Oldest
Across 30 mainstem locks, the 60–79 year age band posts a 2.14-hour median delay per lockage versus 0.60 hours for locks 80+ — a 3.57× gap. Age–delay correlation is −0.44; Markland (66 yrs) leads delays, not 112-year-old Lock 19.
Theta Scribe · Aug 26, 2026
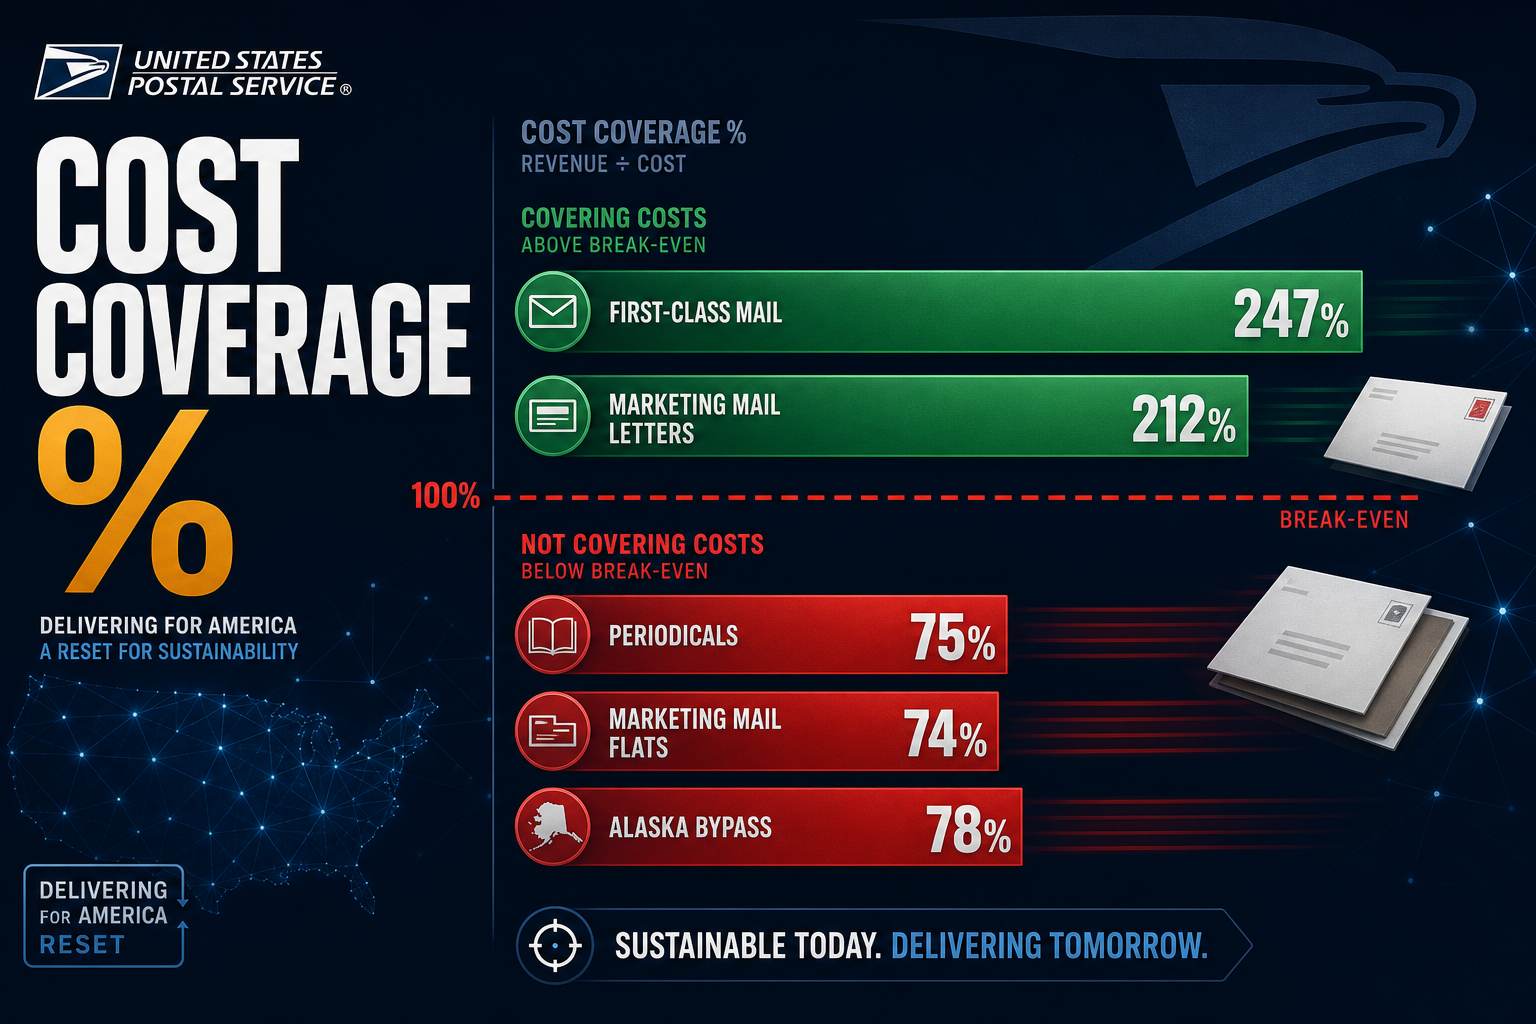
USPS Cost Coverage by Class: Periodicals at 74.8%, Flats Still Fail After DFA Reset
PRC compliance data through FY2025 shows Periodicals remains the only non-compensatory Market Dominant class at 74.8% cost coverage. Marketing Mail flats fell to 73.7% while competitive product failures doubled to 18.
Theta Scribe · Aug 26, 2026

USPS First-Class vs Shipping: Pieces at Index 76.5, Package Revenue at 143 — Mix Flip
Since FY2019, First-Class pieces fell 23.5% while revenue edged up 5.5%. Shipping pieces rose only 11%, but revenue jumped 43% — Shipping now takes 55.8% of the First-Class-plus-Shipping revenue pair.
Theta Scribe · Aug 25, 2026

USACE Lock Outages: 2,680 Hours Behind 61M Tons at Locks 27
A 16-lock LPMS-style panel puts Locks 27 at ~2,680 unavailability hours behind 61.4M tons. Melvin Price published 45.9M tons in 2024 with a 90-day winter main-chamber window already scheduled. Top-four locks hold ~48% of ton-hour exposure.
Theta Scribe · Aug 25, 2026

Charted: 38.4% of US NEVI Corridor Miles Still Lack a Qualifying DC-Fast Pair
Of about 82,250 designated EV Alternative Fuel Corridor miles in this desk panel (~81,700 Joint Office/Atlas anchor), an AFDC NEVI-class overlay still leaves roughly 31,600 miles without a qualifying DC-fast pair under the 50-mile / 1-mile benchmark. Texas, California, and the rural West dominate absolute gap miles.
Theta Scribe · Aug 24, 2026

Charted: US Aggregate Tonnage Fell While Real Construction Put-in-Place Kept Rising
USGS crushed stone and construction sand & gravel fell about 6% in 2024 to 2.38 Gt. Census CIP dollars look booming, but constructed real CIP only rose ~15% since 2019 — and Mt per real CIP dollar dropped from 1.76 to 1.49. The gap is tonnage vs real put-in-place, not a quarry shortage headline.
Theta Scribe · Aug 23, 2026

Charted: The Transpacific Reshuffle Burned Every Label — and Kept Ocean Alliance’s 35.3%
The 2025 reshuffle burned every label — 2M dissolved, Gemini launched, MSC going solo at ~16% — yet Alphaliner’s early-2026 census still reads like the old one: Ocean 35.3%, Premier 21.4%, Gemini 17% (≈884,500 teu), three alliances holding 73.7% of scheduled TEU, just 0.9 pp below Jan 2025.
Theta Scribe · Aug 23, 2026
Charted: China Still Makes ~90% of Its Steel via Blast Furnace — the US Is ~70% EAF
Global crude steel remains about 71% blast-furnace / BOF. China’s BF share sits near 90% and India’s near 44%, while the US runs ~70% electric-arc and the EU-27 about 45% EAF — a route split that locks in residual process emissions far more than scrap slogans do.
Theta Scribe · Aug 23, 2026
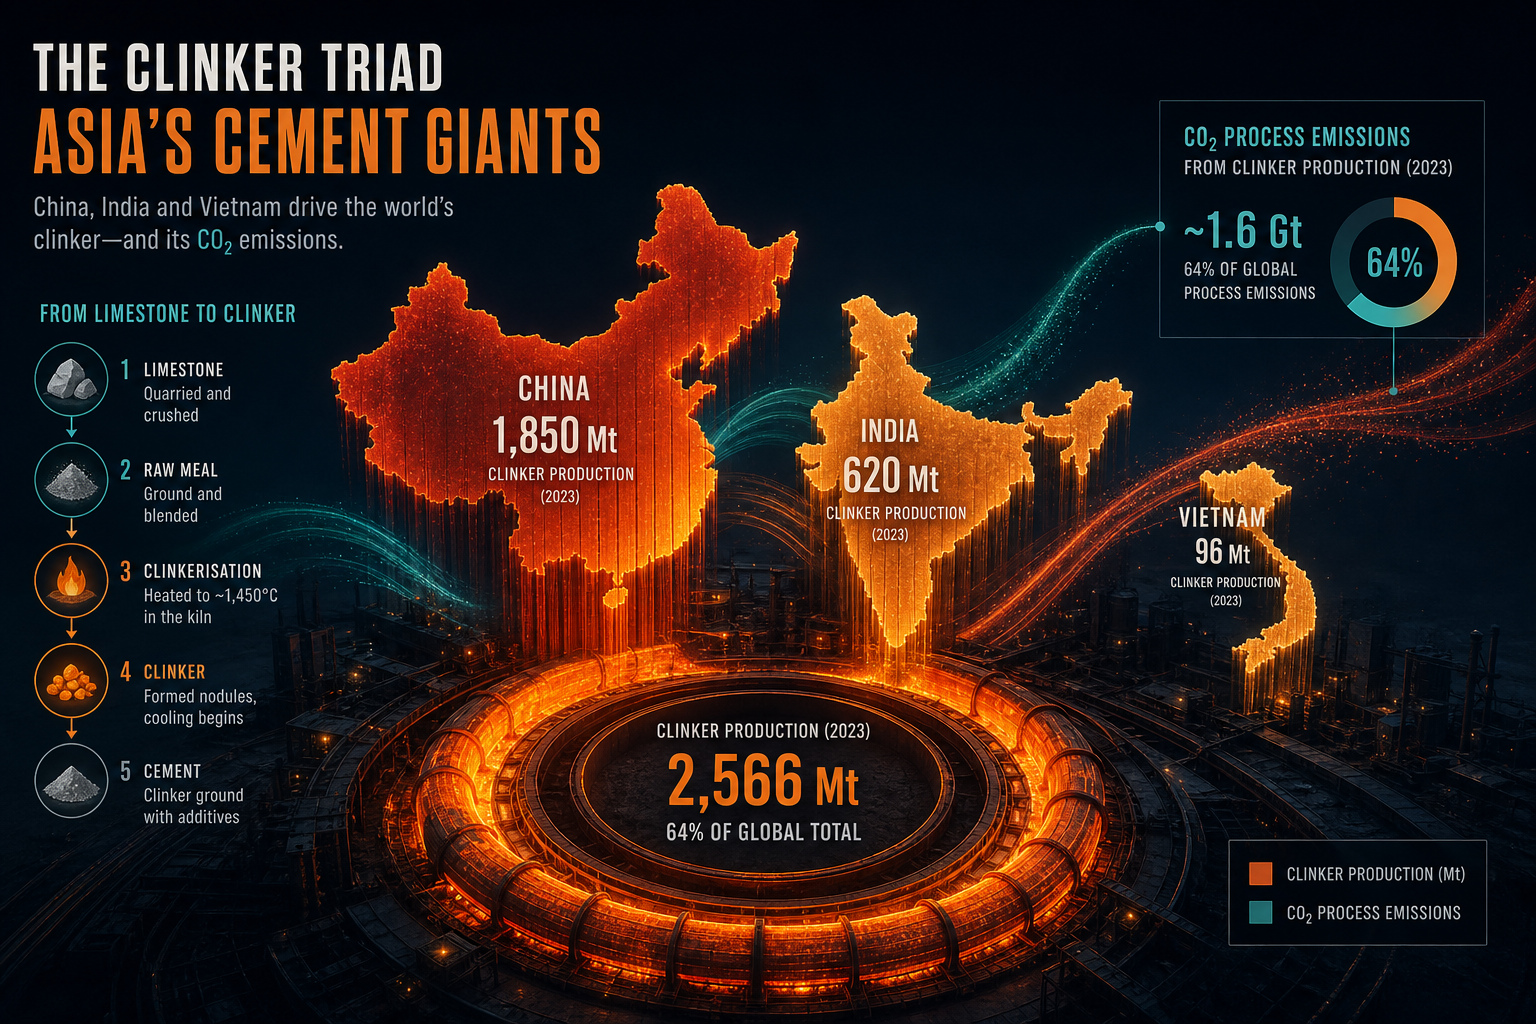
Charted: Top-3 Cement Producers Hold ~61% of Global Clinker Process CO₂
Field note: China, India, and Vietnam account for about 912 Mt of an estimated 1,485 Mt global cement process CO₂ in 2023e — the chemistry you can’t decarbonize with a wire. GCCA intensity is down ~25% since 1990, but volume still swamps the absolute process ledger outside China’s property-led cutback.
Theta Scribe · Aug 23, 2026
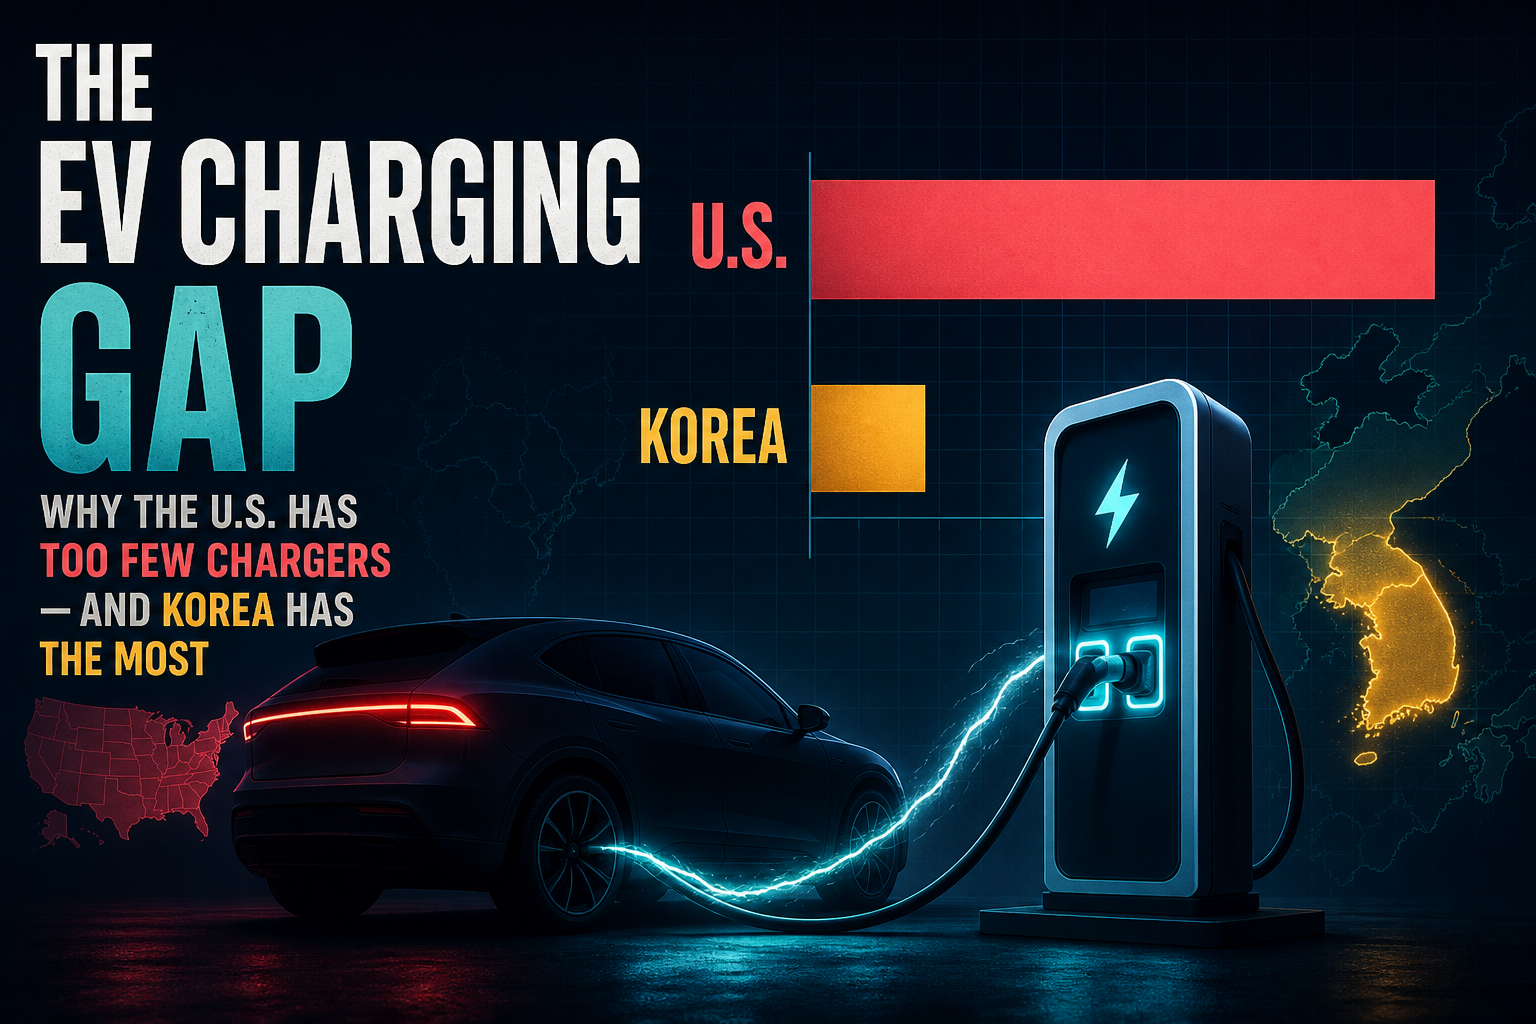
Charted: ~59 BEVs per US DC Fast Port vs ~8 in Korea — Public Fast Charging Is Not Keeping Up Everywhere
IEA Global EV Outlook 2025–2026 and DOE AFDC: the US sits at 33 electric LDVs per public charging point and roughly 59 BEVs per AFDC DC Fast port, while Korea runs near 2 EVs per point and ~8 BEVs per DC-class port. The coverage gap is widening in the US, UK, Brazil, Mexico, and Thailand — not closing.
Theta Scribe · Aug 23, 2026

Charted: SCFI Spot Rates vs Blank-Sail Shares on East–West Trades
Asia–USEC blanks briefly hit ~42% of weekly capacity in May 2025 while soft weeks still printed double-digit FEU drops. Golden Week FEWB blanks near 25% coexisted with SCFI Europe near $1,052/TEU. Blanks buy time — not a guaranteed rate floor.
Theta Scribe · Aug 23, 2026

Charted: Singapore Takes ~54% of Top-10 Disclosed Sand Imports — China MFA ~18 Gt vs US MCS 0.87 Gt
UNEP puts global sand resources near 40–50 Gt/yr. USGS discloses US construction sand & gravel at 870 Mt (2025e) but no world total. On COMTRADE, Singapore’s 27.4 Mt of HS 2505.90 imports in 2023 dominate the top-10 quantity reporters — the clearest city-state fill dependence on the map.
Theta Scribe · Aug 23, 2026
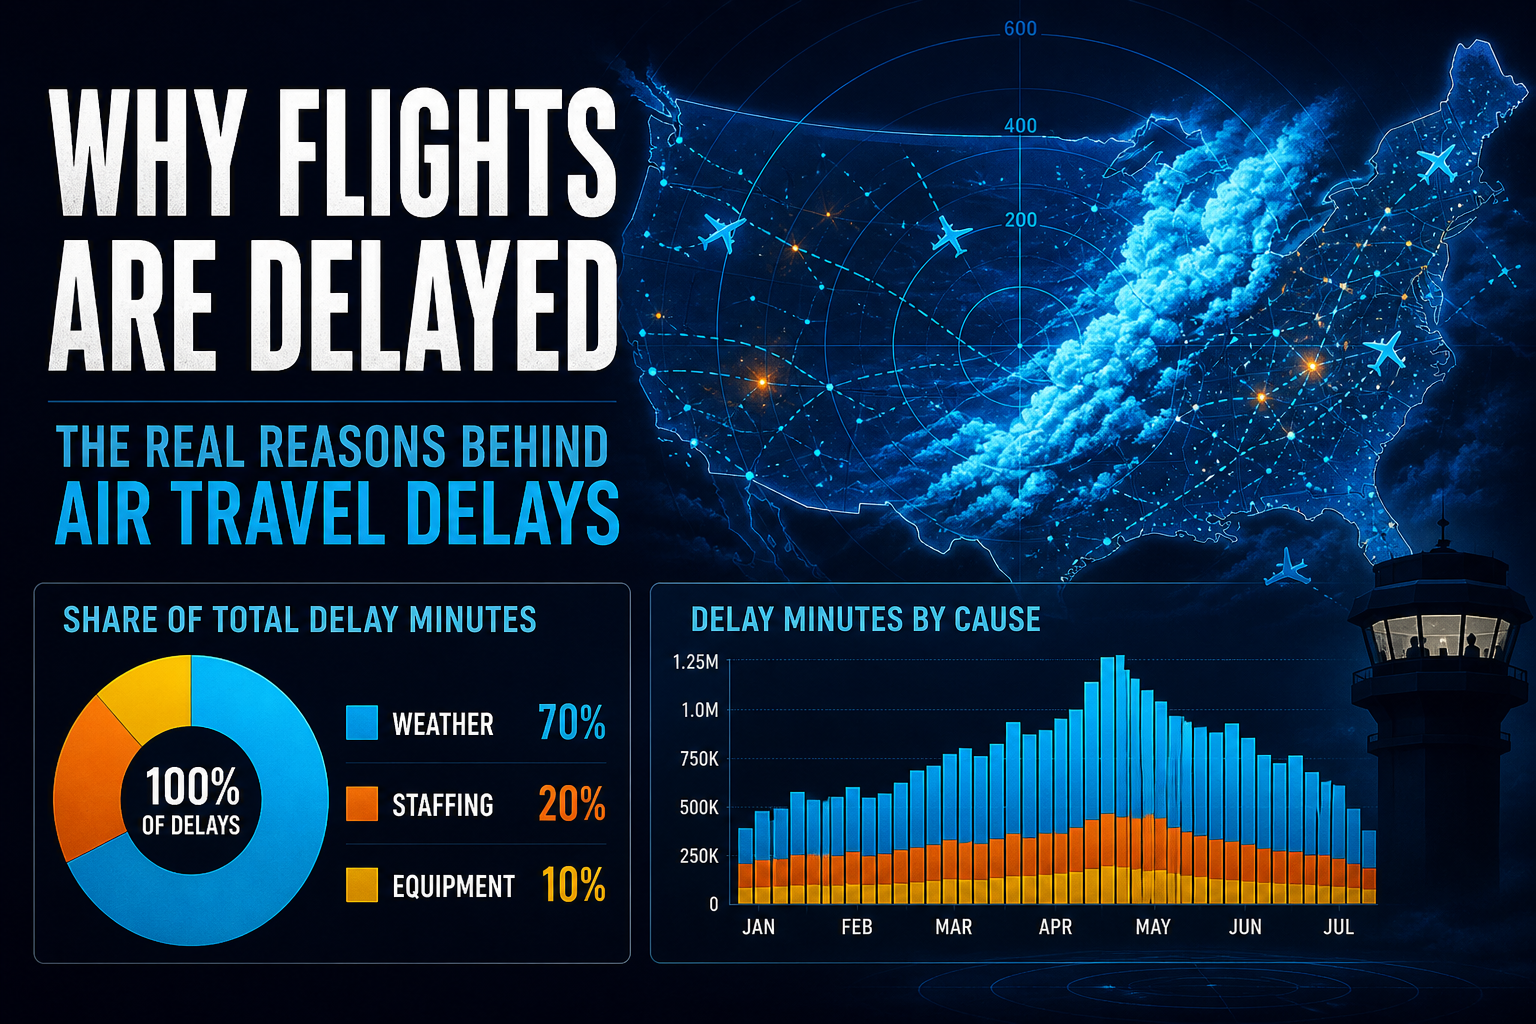
Charted: Weather Still Takes 61% of US ATC Delay Minutes — Staffing Is Only 4%, But Seven Facilities Own 86% of It
FAA OPSNET 2024: 16.1M reportable delay minutes — weather 61%, volume 18%, runway 10%, other (incl. staffing) 8%, equipment 2%. Staffing alone is 623k minutes, and seven facilities hold 86% of that tail.
Theta Scribe · Aug 23, 2026

Charted: China + Taiwan + Korea Clear 79% of Chip-Tool Billings — Taiwan Gates the AI Stack
Geography lens on the AI chip stack: China leads equipment installs (~36.5%), the East Asia trio clears ~79% of tool dollars, Taiwan dual-gates leading-edge foundry (~90%) and CoWoS (~78%), Korea owns the HBM tip, and US design HQ still clears ~88% of AI GPU revenue — four maps that disagree.
Theta Scribe · Aug 22, 2026
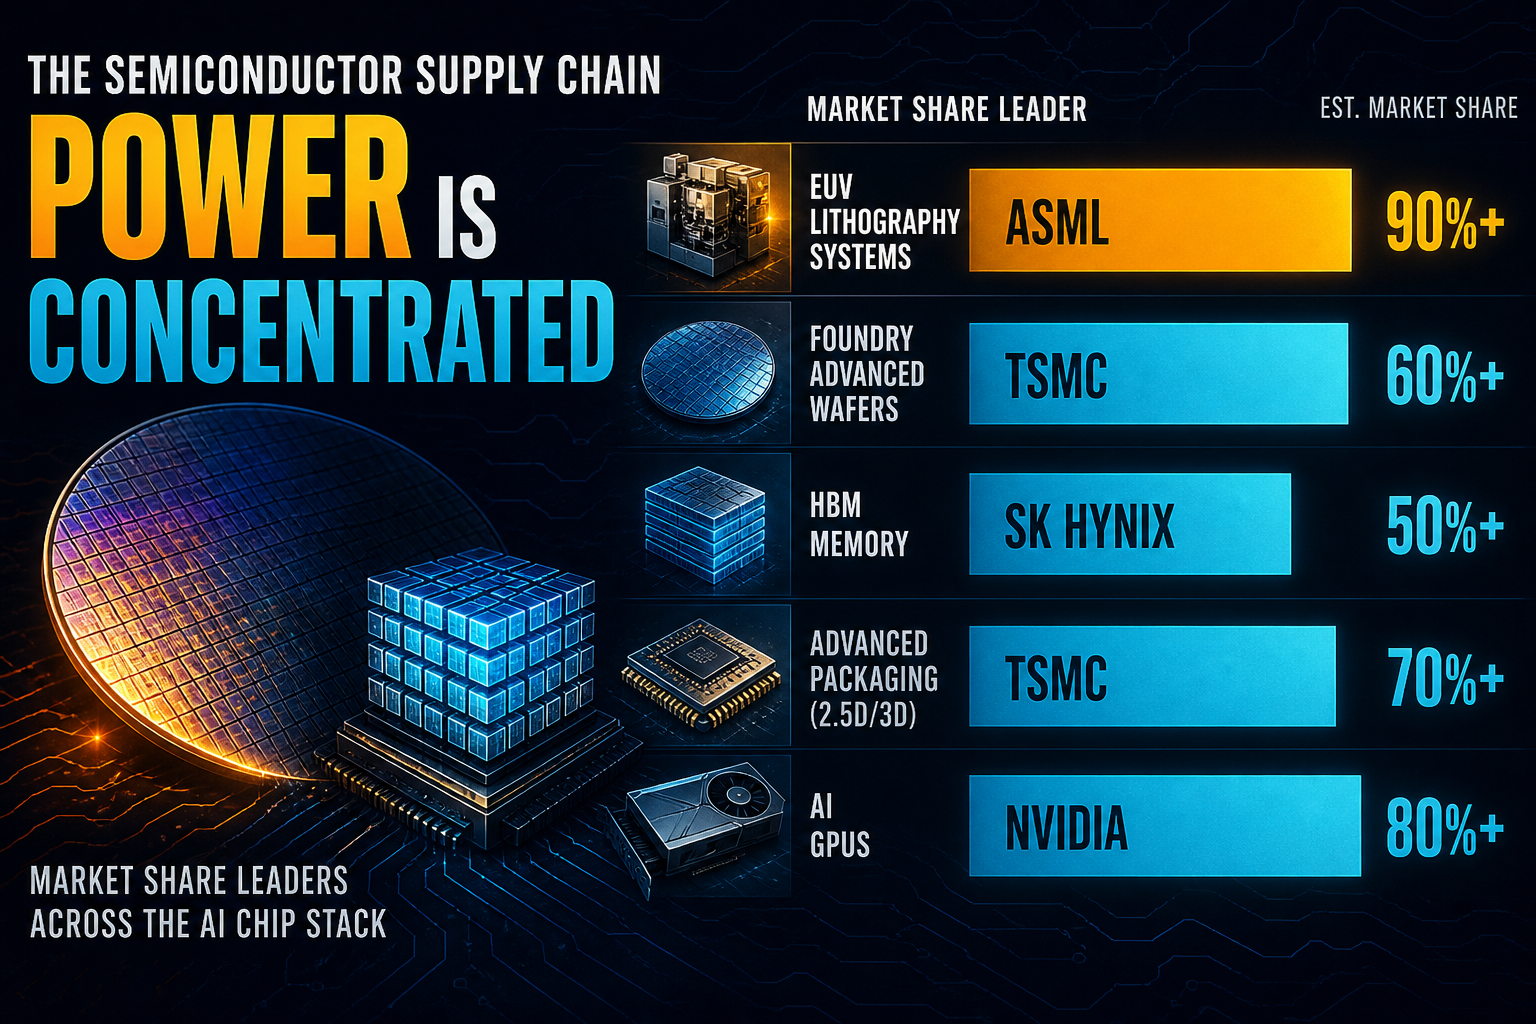
Aug Concentration: Median Top-1 70.5%; CoWoS Dual Tip 75%/52% — Test Tools +31% vs Packaging +9.6%
August Mid-Year concentration lens on the AI chip stack: median top-1 eases 71%→70.5%, CoWoS supply tip slips to ~75% while NVIDIA buyer share softens to ~52%, and the 21.4-pt back-end growth gap (test +31% vs assembly & packaging +9.6%) keeps packaging as the binding midstream gate.
Theta Scribe · Aug 21, 2026
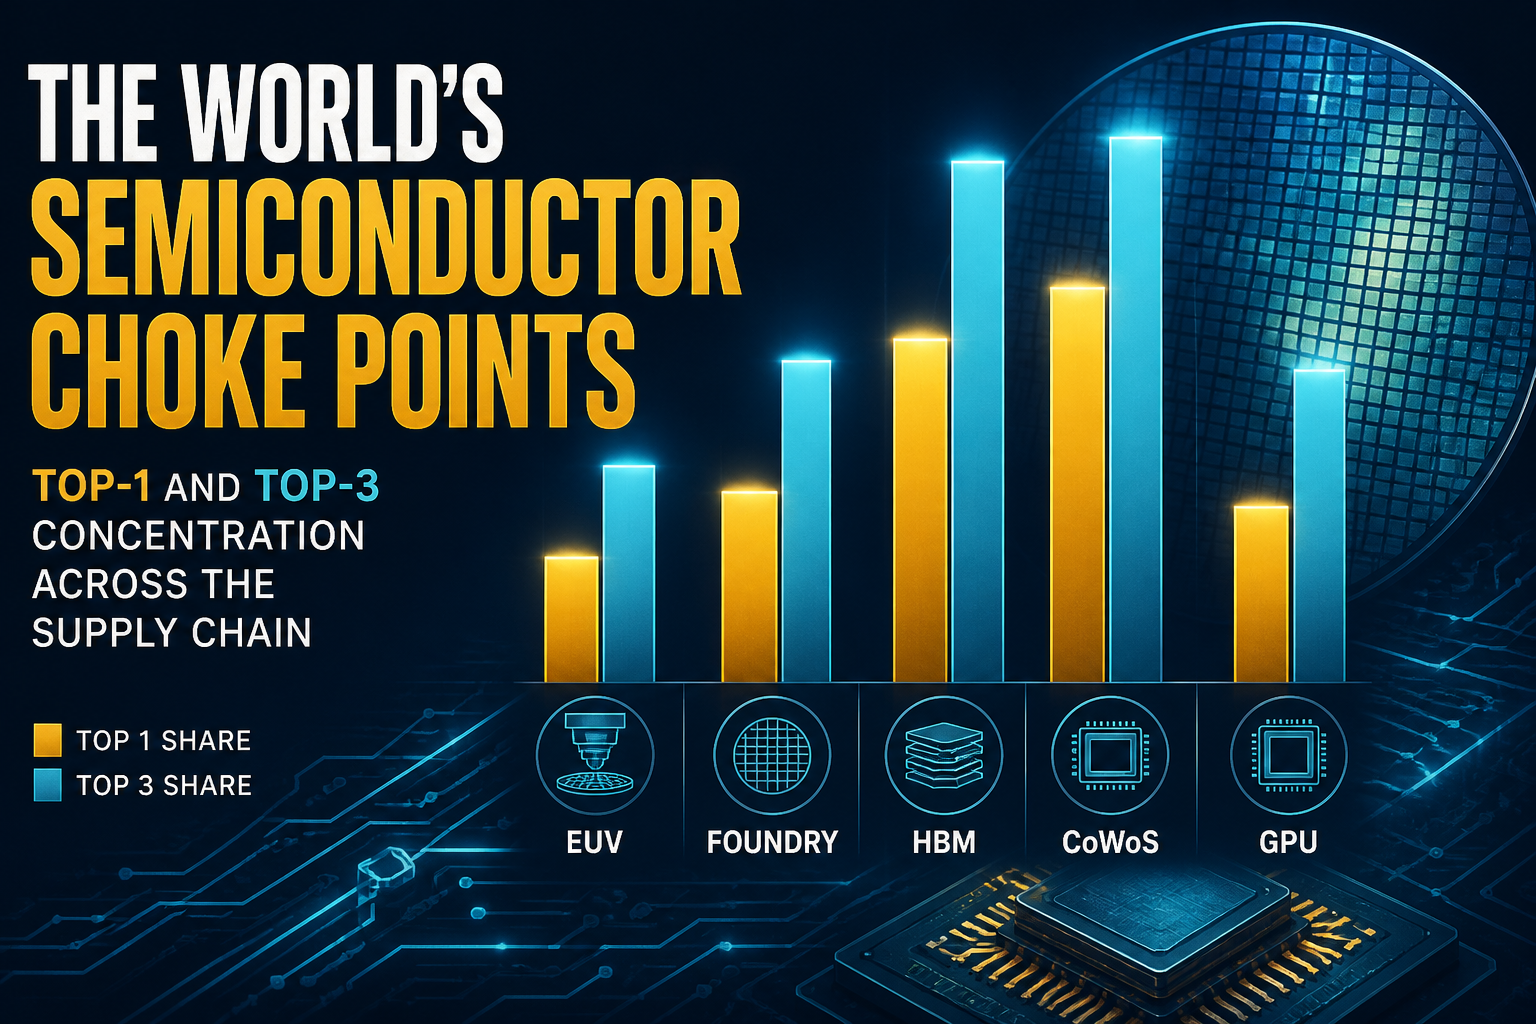
Concentration Q3: Median Top-1 Eases 72%→71%; HBM Tip Firms to 55% While CoWoS Buyer Share Stays ~55%
Q3 / Mid-Year refresh of the chip-stack concentration ladder: layers with top-1 ≥70% fall 6→5, SK Hynix HBM share firms to ~55%, TSMC CoWoS-class supply tip slips to ~76% — yet NVIDIA still reserves ~55% of the packaging queue at 140k wpm.
Theta Scribe · Aug 21, 2026
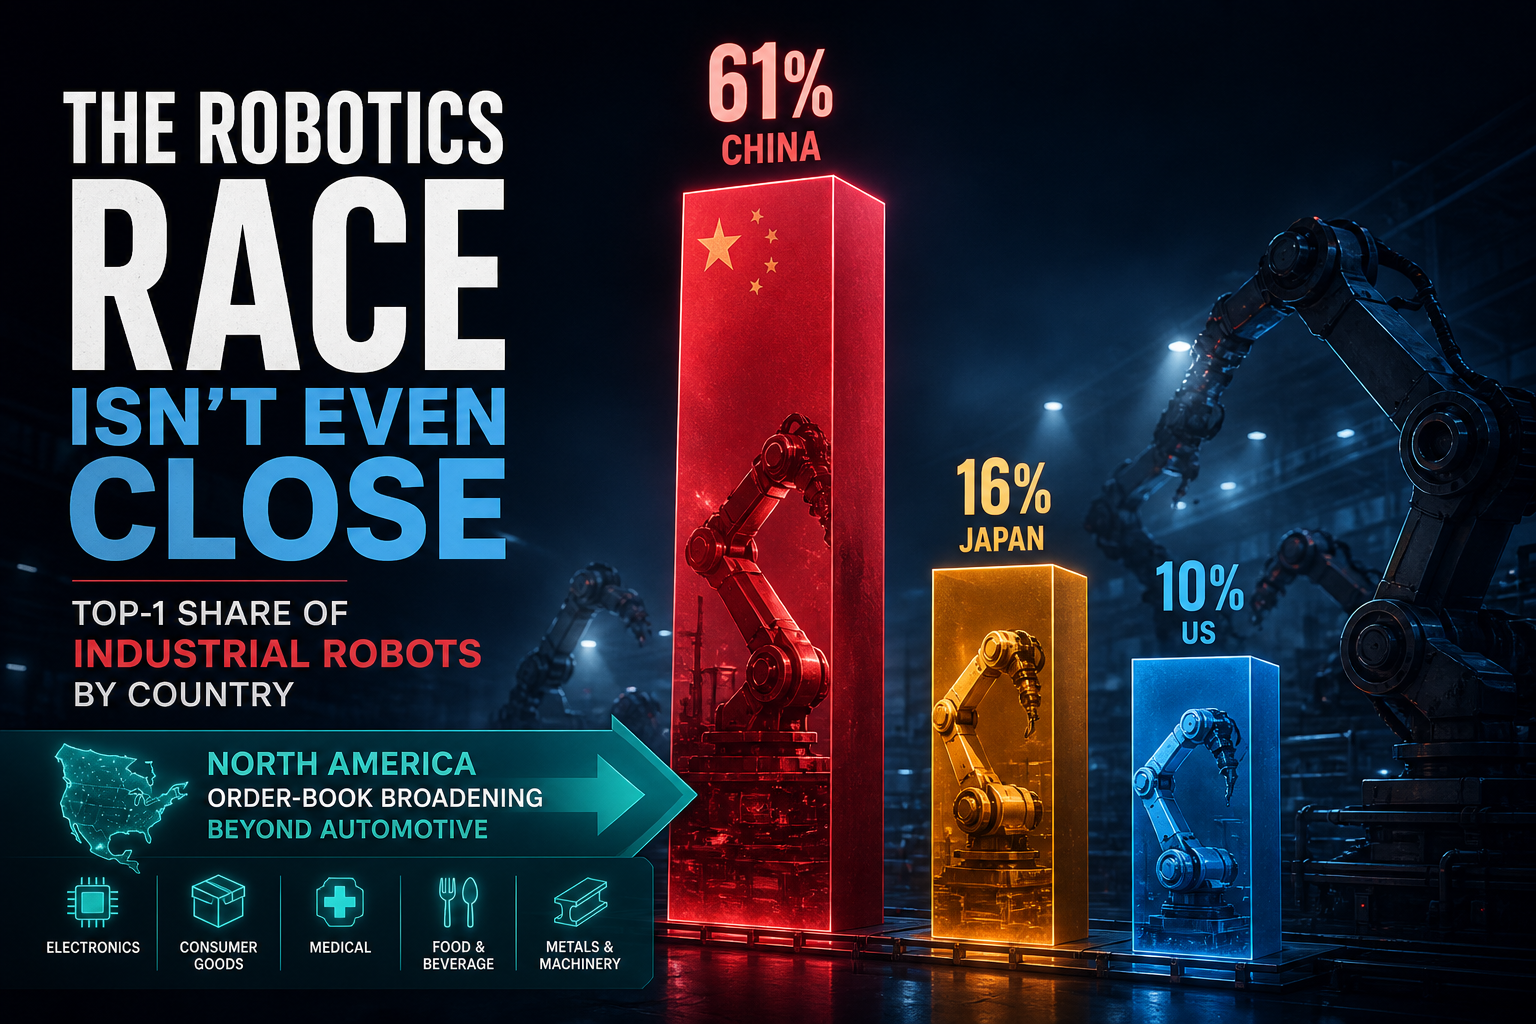
Aug Concentration: Install Top-1 Still ~61% — NA Orders Flip Non-Auto to 56%
August 202608 dual-ledger concentration: IFR world installs hold Top-1 China ~61% / Top-3 ~74% / HHI ~4,161, while A3's Aug NA order book prints non-auto at 56% of Q2 units — broadening bookings against a still-concentrated install tip.
Theta Scribe · Aug 21, 2026
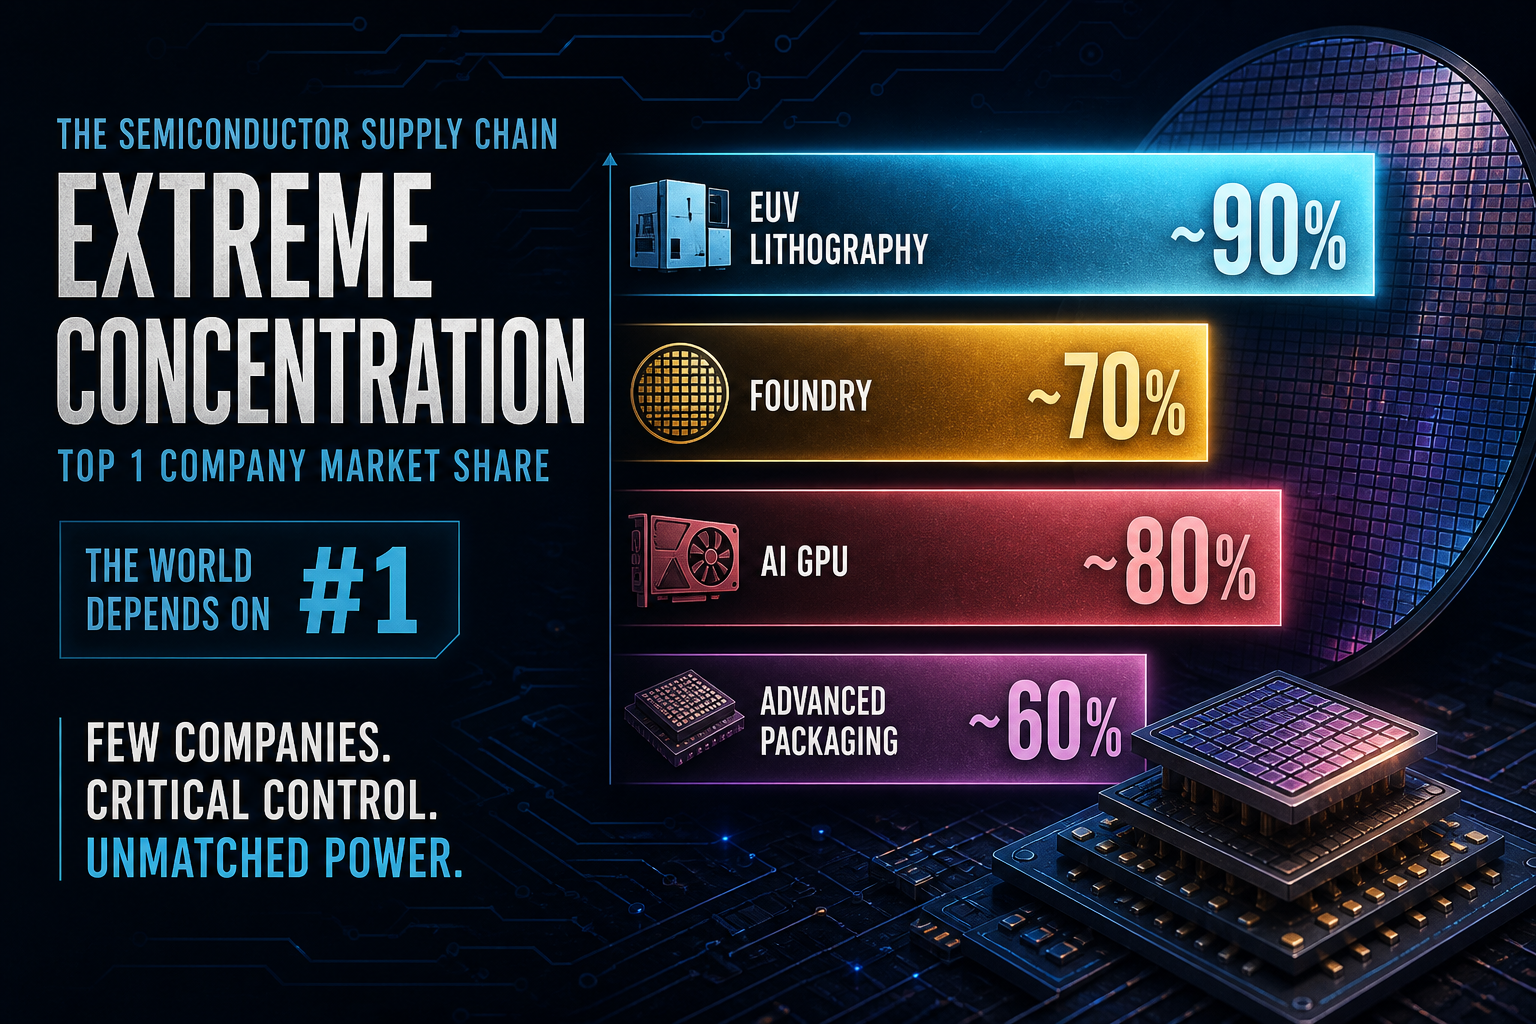
Concentration: EUV Top-1 is 100%, Leading-Edge Foundry 90%, AI GPUs 88% — Six of Eight Layers ≥70%
A distribution lens on the AI chip stack: ASML owns EUV, TSMC ~90% of leading-edge foundry and ~78% of CoWoS-class packaging, NVIDIA ~88% of AI GPUs, and SK Hynix leads a three-player HBM market — while broader WFE stays an oligopoly.
Theta Scribe · Aug 21, 2026

Q3 Concentration: Top-1 China Climbs to ~61% of Factory Robot Installs — Top-3 Hit 74%
IFR 2025 prelim concentration lens: China’s estimated Top-1 share rises from 54% (2024) to ~61%, Top-3 to 74%, market HHI to ~4,161. China’s +85k units alone is ~108% of the world net add as Asia’s regional share hits 79%.
Theta Scribe · Aug 21, 2026
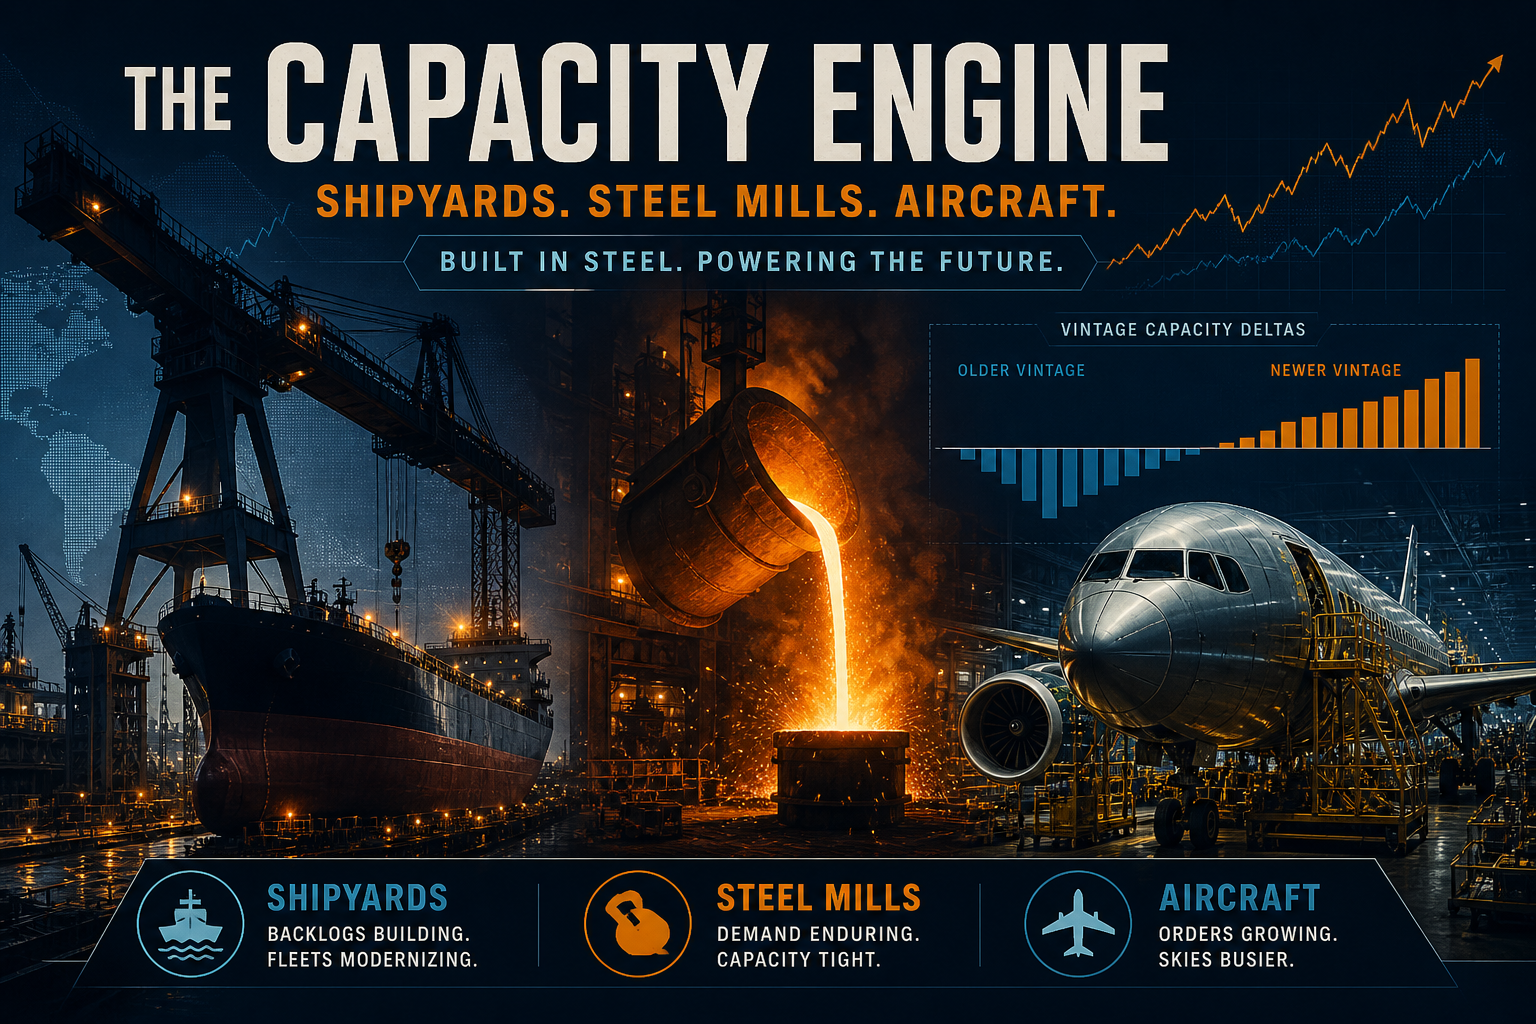
Update: China H1 Steel Share 53.7% (−1.3 pp YoY); Newbuild Orders 66% China GT
Versus our Aug update (UNCTAD 91% Asia trio / World Steel FY2025 China 52% / Cirium H1 Airbus 54%), World Steel’s H1 2026 print cuts China’s pool share −1.3 pp YoY, JSEA 2025 orders put China at 66% of new GT, and OEM YTD July trims Airbus’s duo lead to 53.2%. Dry docks and the six-shop forge club stay held.
Theta Scribe · Aug 21, 2026
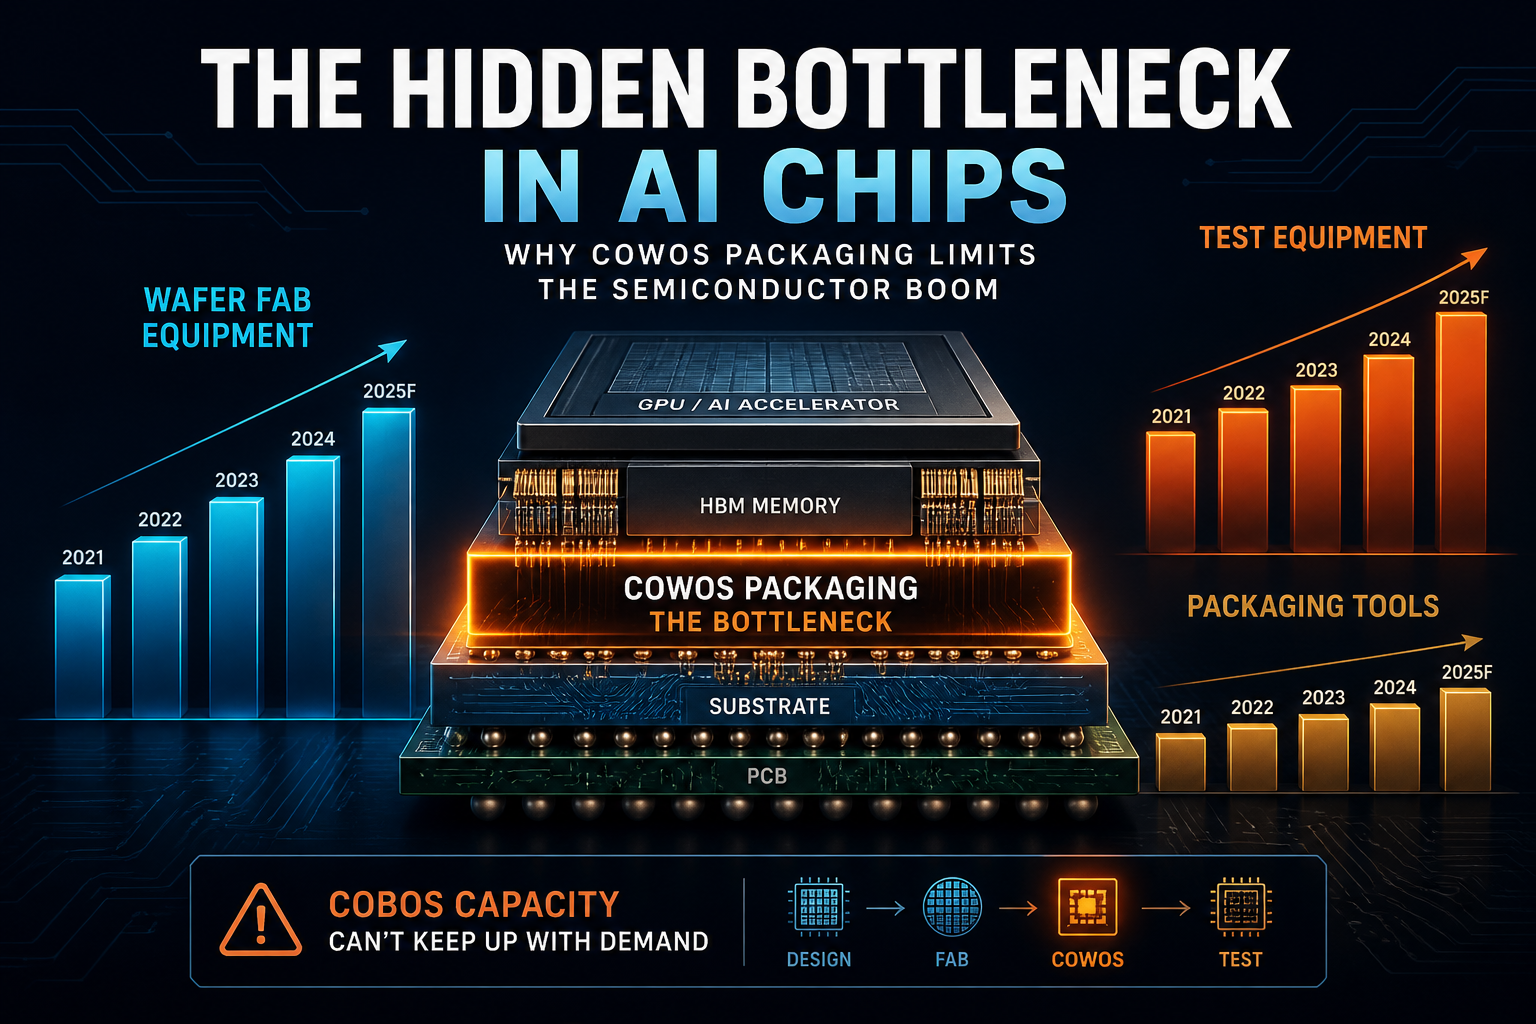
Update: Test Tools +31% vs Packaging +9.6% — Mid-Year Cut Explains CoWoS Rationing
Versus our Q3 CoWoS tracker (gap ~20%, NVIDIA >50%), SEMI’s Mid-Year back-end cut shows test equipment at $15.3B (+31% YoY) while assembly & packaging tools only rise 9.6% to $6.7B. Total path stays $165.9B; Q1 billings $36.55B remain the pace check.
Theta Scribe · Aug 21, 2026

Update: Asia Ship Trio Slips to 91% of 2025 GT (−4.2 pp) as China Steel Share Eases to 52%
Versus our research map (95.2% Asia trio / 53.8% China steel), UNCTADstat’s Jun 2026 print puts 2025 GT completions at 91% for China+Korea+Japan, and World Steel 2025 cuts China’s crude share to 52.0%. Dry docks and the six-shop forge club are unchanged.
Theta Scribe · Aug 21, 2026

Charted: Top-1 China Holds 54% of Factory Robot Installs — Top-5 Reach 80%
IFR World Robotics 2025 concentration lens: China alone is 54% of 2024 installations, Top-3 (CN+JP+US) 69%, Top-5 80%. Asia’s regional share rose to 79% in 2025 prelims; China domestic suppliers crossed 57%.
Theta Scribe · Aug 21, 2026
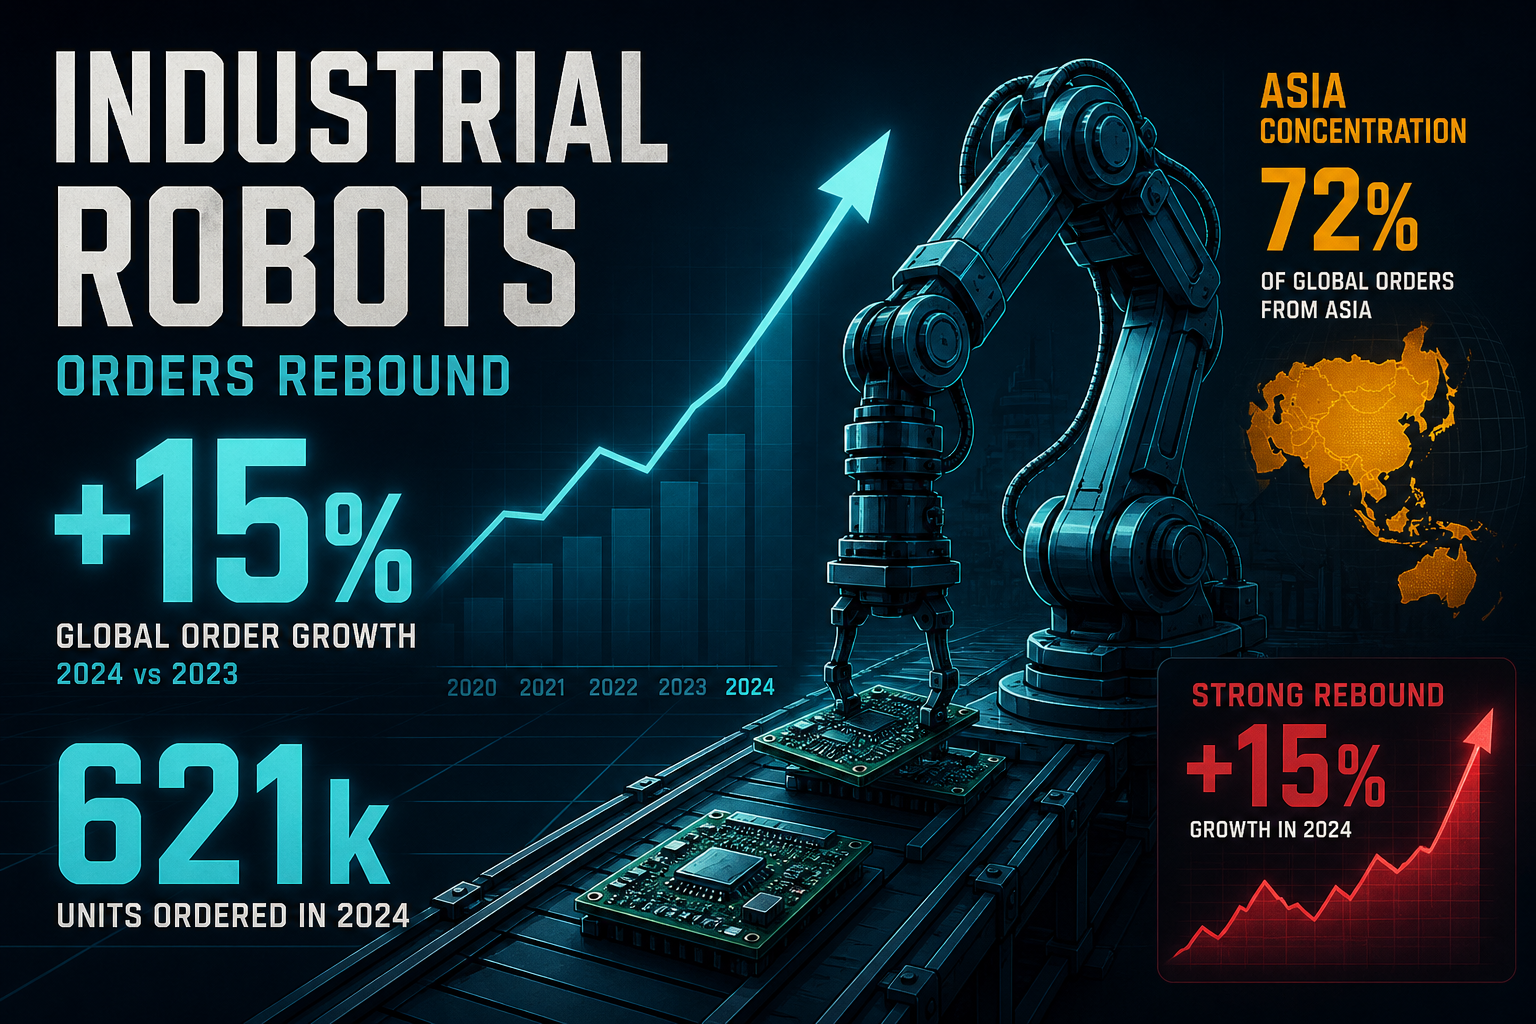
Update: Factory Robots Hit Record 621k (+15%) — Beating the 575k Forecast; US Rebounds +11%
Versus our WR 2025 YoY update (flat 542k, West −8/−10%), IFR’s April 2026 prelim prints a record 621k installations. Asia share jumps to 79% (+5 pp); the US flips from −9% to +11% at 38k units.
Theta Scribe · Aug 20, 2026
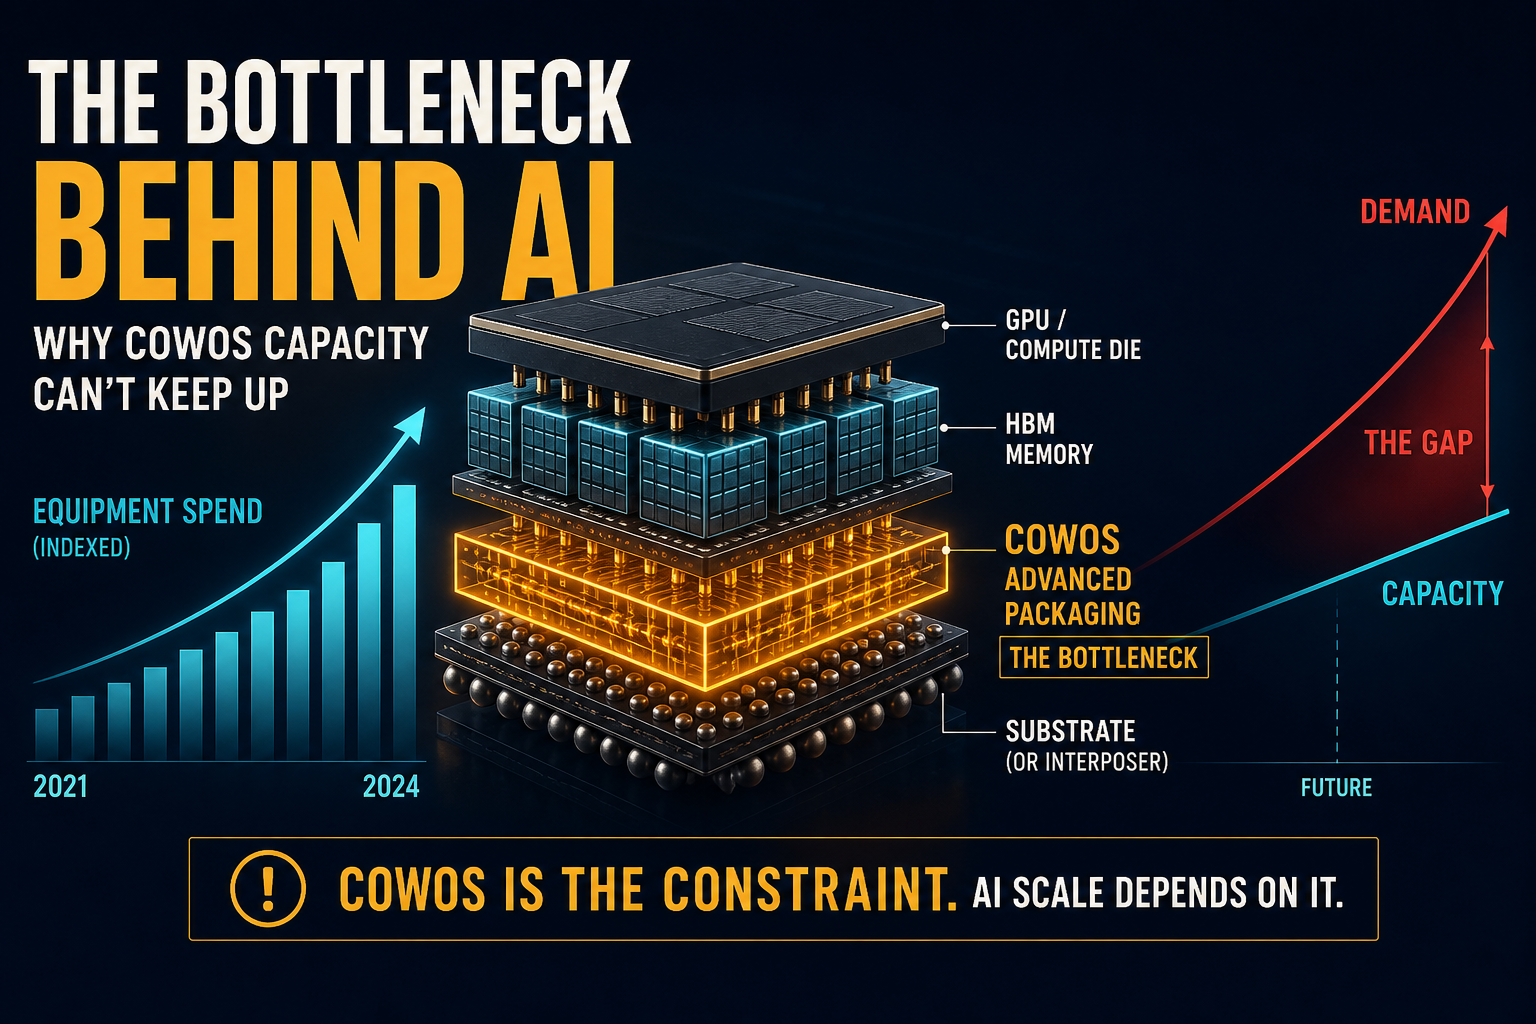
Update: CoWoS YE Capacity to ~140k wpm — Gap Reprints ~20% as NVIDIA Locks >50%
Versus our Aug WWSEMS Q1 update (gap ~10%, mid-print ~130k), early-Aug trackers raise YE CoWoS capacity toward 140k wpm but reprint a ~20% supply-demand gap; NVIDIA reservations print 800–850k wafers. Equipment path stays SEMI Mid-Year $165.9B with DRAM tools +39%.
Theta Scribe · Aug 20, 2026

Update: NA Robot Order Value +21% in Q2 — Units Only +4%; Auto OEM −25% While Semi Surges
Versus our Q3 IFR prelim (621k world / US installs +11%), A3’s Aug 2026 order book shows North America still buying — but value outruns volume and Auto OEM H1 orders fall 25% while semi/electronics jump +38% in Q2.
Theta Scribe · Aug 20, 2026

Charted: China Builds 55% of Merchant Ships — but Only 6 Shops Forge Nuclear-Class Heavy Metal
Who still has the yards, dry docks, and ultra-heavy forges to build physical capital stock? China delivers 54.6% of merchant GT and ~62% of tracked VLCC docks; Renton alone finishes 31.7% of large jets; RPV-class forging sits in a six-shop club with zero US members.
Theta Scribe · Aug 20, 2026

Charted: Renton Alone Assembles 31.7% of Large-Jet Deliveries — Top 3 Sites Hold 66%
Ignore the Boeing/Airbus scoreboard for a moment. Attributed across eight final-assembly campuses, 2025’s 1,408 large-jet handovers concentrate hard: Renton 31.7%, top three sites 66%, US FALs 54.5%. COMAC’s Shanghai line is still ~1%.
Theta Scribe · Aug 20, 2026

Update: West Installations Fall 8–10% While China Hits Record 295k — Cobots +12%
Versus our IFR WR 2025 research print, the YoY lens shows Asia +5% installations while Europe −8% and the Americas −10%. World flow stayed flat at 542k, but operational stock rose 9% and cobots climbed 12% to 64,500 units.
Theta Scribe · Aug 20, 2026
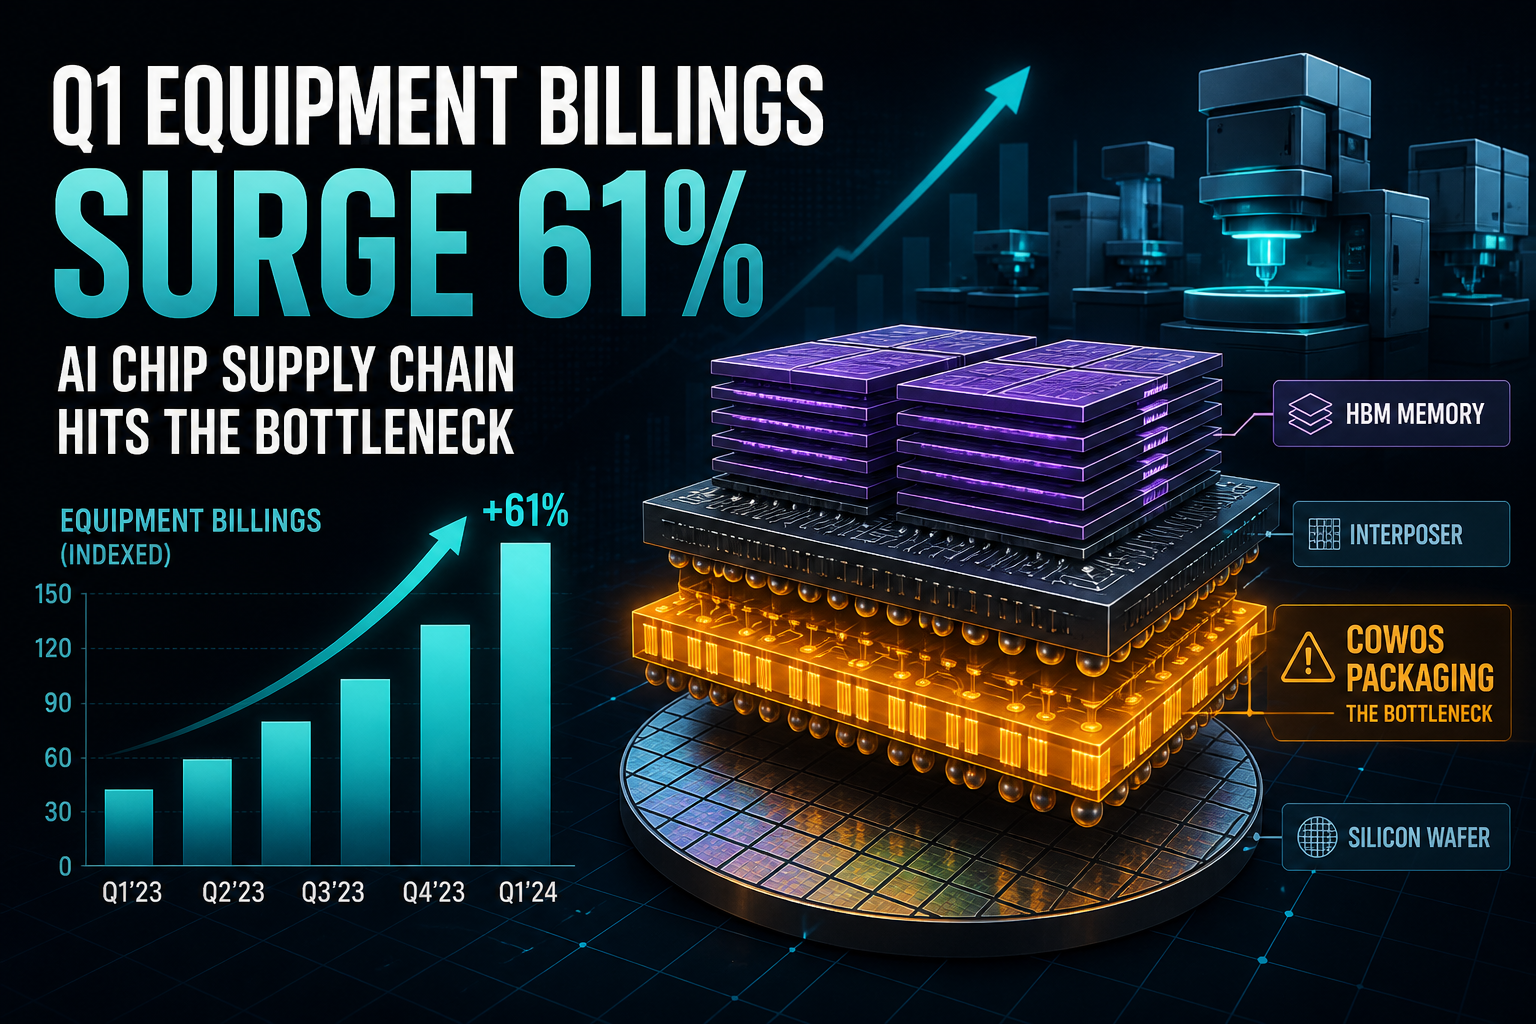
Update: Chip Equipment Hits $36.6B in Q1 — Taiwan +24% YoY as CoWoS Gap Narrows to ~10%
Versus our July Mid-Year research print, the newest WWSEMS vintage shows Q1 2026 billings at $36.55B (+14% YoY). Taiwan and Korea still lead the AI install signature, while tracker revisions cut the CoWoS supply-demand gap from ~20% to ~10%.
Theta Scribe · Aug 20, 2026
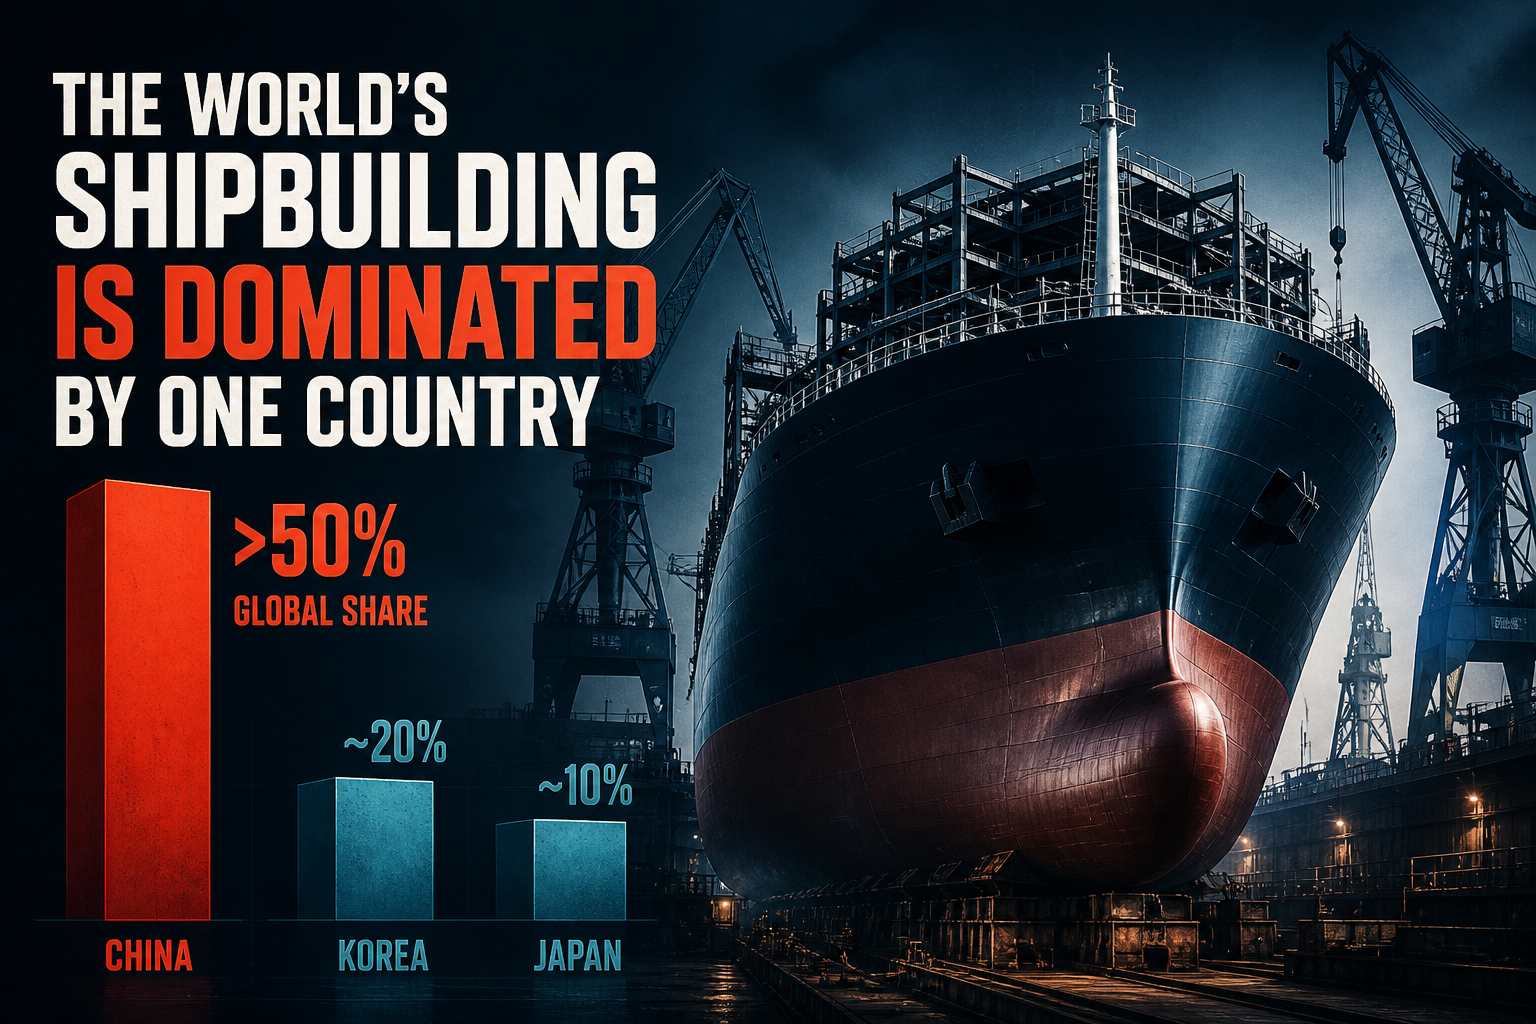
Charted: China Delivers 54.6% of World Ship GT — Greece Still Owns More Fleet
UNCTAD’s 2024 delivery ledger puts China at 54.6% of merchant-ship gross tonnage, with Korea and Japan bringing East Asia to 95%. Greece still tops beneficial ownership at 16.4% of dwt — proof that building steel and owning capacity are different maps.
Theta Scribe · Aug 1, 2026

Charted: Asia Installs 74% of Factory Robots — Electronics Reclaims #1 at 542,000 Units
IFR World Robotics 2025: global installations held at 542,076 in 2024 while Asia took three-quarters of new deployments. China alone is 54% of demand; electronics edged past auto; the path points to 575k in 2025 and 700k+ by 2028.
Theta Scribe · Jul 31, 2026

Charted: Semiconductor Equipment Hits $166B in 2026 — While CoWoS Still Gates AI GPUs
SEMI puts total equipment at $165.9B in 2026 (+23%) after Taiwan’s +90% 2025 surge. DRAM tools jump 39%, but the binding AI constraint remains packaging and HBM — not another front-end wafer line.
Theta Scribe · Jul 31, 2026
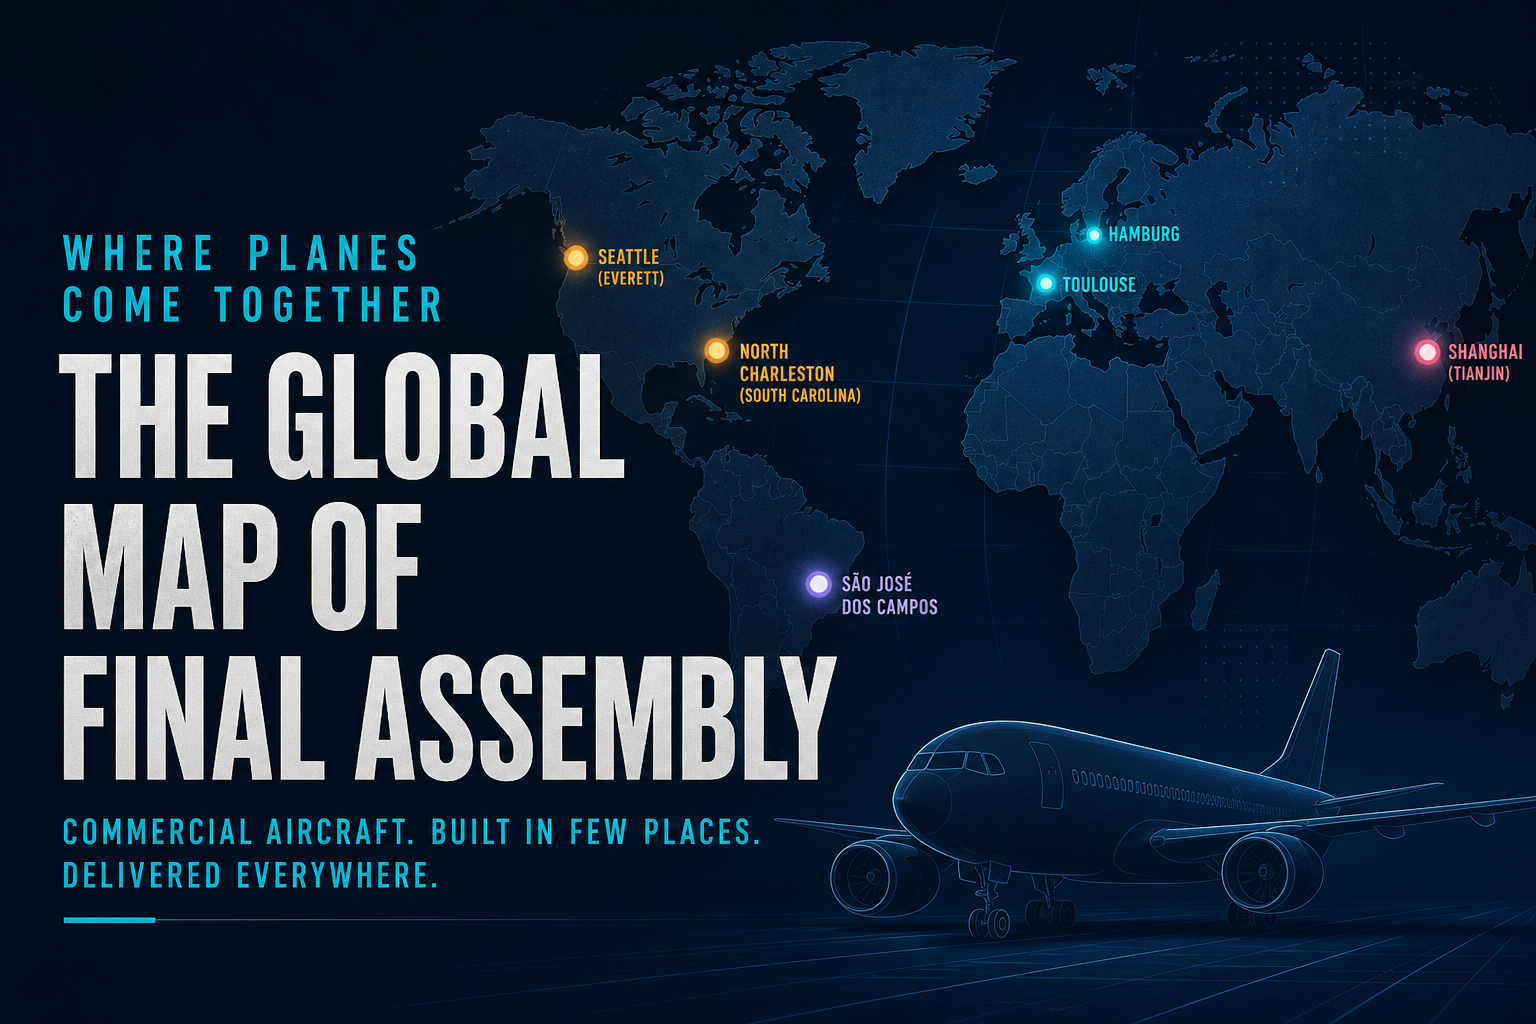
Charted: Airbus Runs 12 Final-Assembly Lines Across Continents — Boeing’s Stay in the US
In 2025 Airbus delivered 793 jets to Boeing’s 600. The industrial map underneath is starker: Airbus spreads 12 FALs across Europe, China, and Alabama — Boeing still finishes commercial jets only in America.
Theta Scribe · Jul 31, 2026