
Publication archive
Research essays & visual analyses
This is the library of original chart-and-analysis pieces — 340 stories, newest first. Each entry is a standalone research essay with its own figure and sourced argument, not a feed of recycled dashboards.
How to read this archive
Open any title for the interactive figure, the written argument, named sources, and publisher standards. Prefer browsing by topic if you want a beat rather than a date sort. New readers can start with About and editorial standards before diving the full catalog.
Newest first
Each card opens a full essay — figure, argument, and cited agencies — not a thumbnail-only doorway.
12 of 340
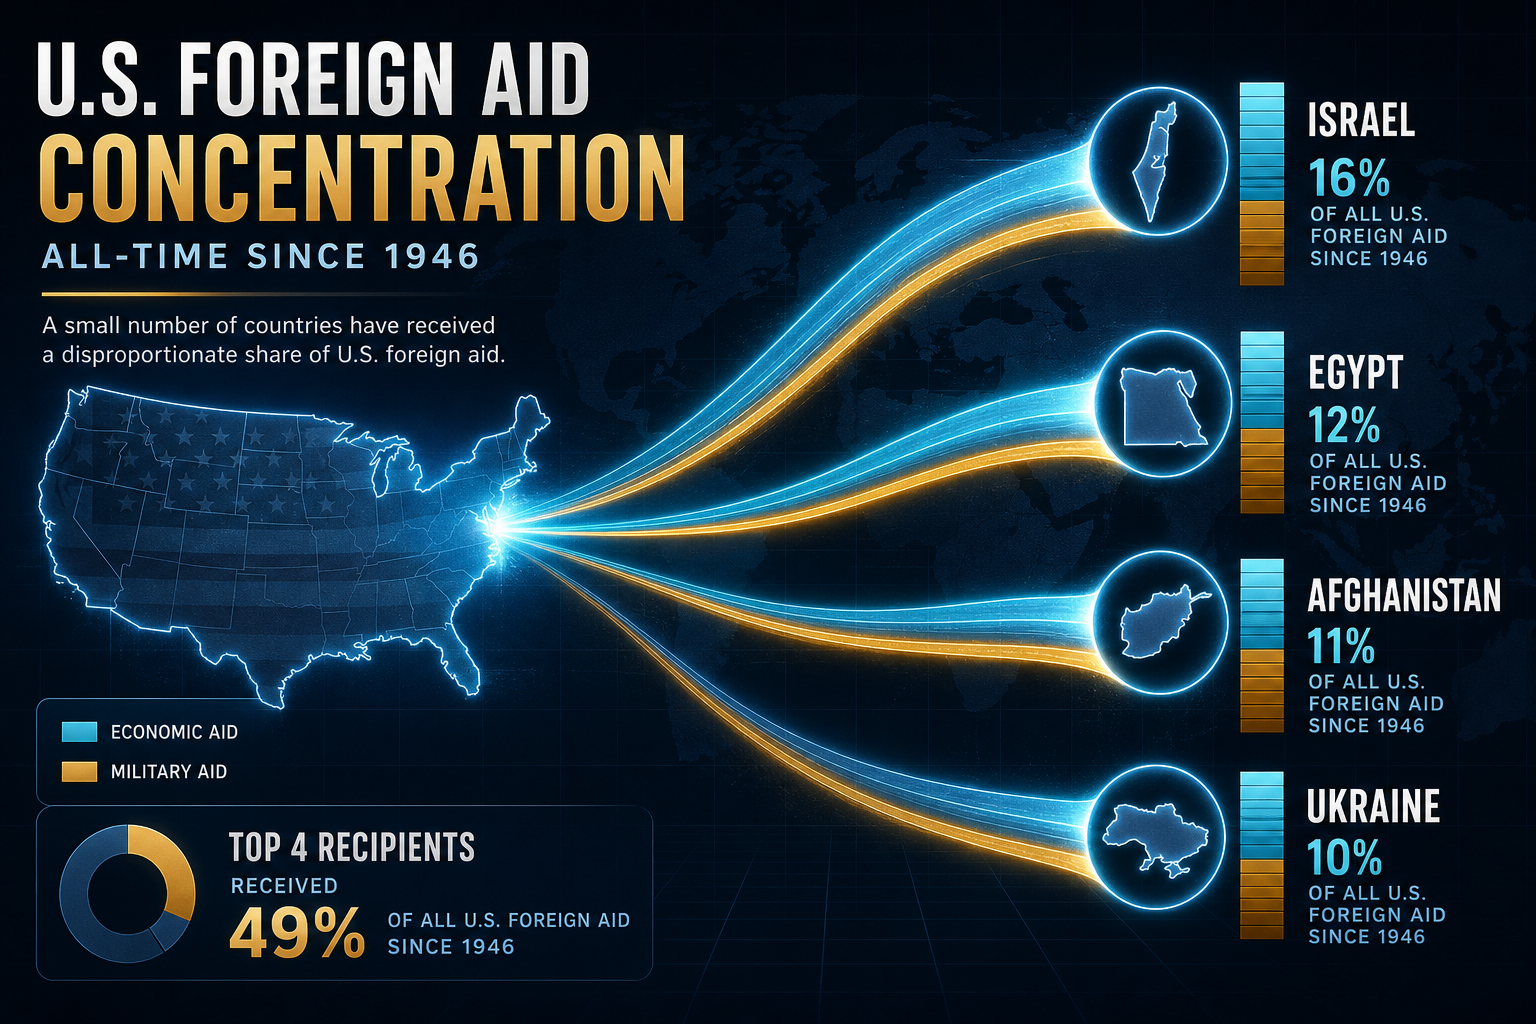
Charted: Four Countries Took 25% of All US Foreign Aid Since 1946 — FY2025 Obligations Halved
ForeignAssistance.gov obligations in constant FY2025 dollars: $3.76 trillion all-time across 204 country recipients — 68.5% economic / 31.5% military. Israel (~$373B), Egypt (~$229B), Afghanistan (~$204B), and Ukraine (~$155B) dominate the ledger; FY2025 fell to $48.3B from a $105.3B FY2023 peak.
Theta Scribe · Sep 3, 2026
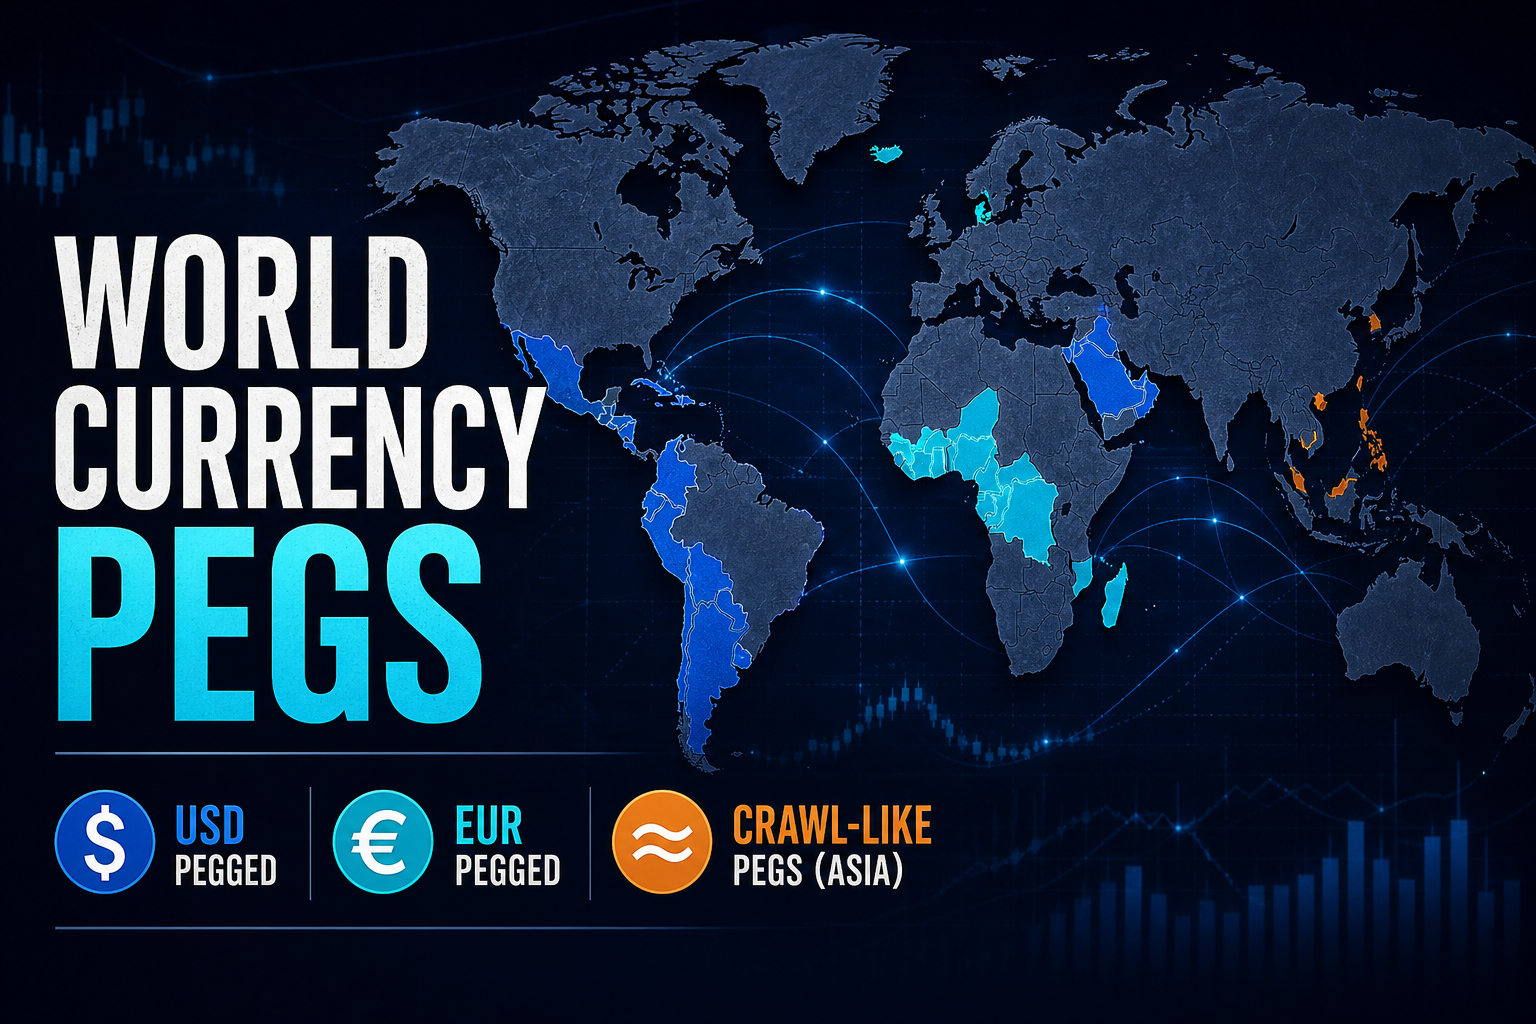
155 Countries Still Lock Their Exchange Rate to Someone Else's Currency
IMF AREAER 2023 de facto classes, updated through September 2026 — two world maps and a country table covering hard pegs, soft parities, dirty floats, crawl-likes, and the dual-rate regimes where the official price is not the price you get.
Theta Scribe · Sep 2, 2026
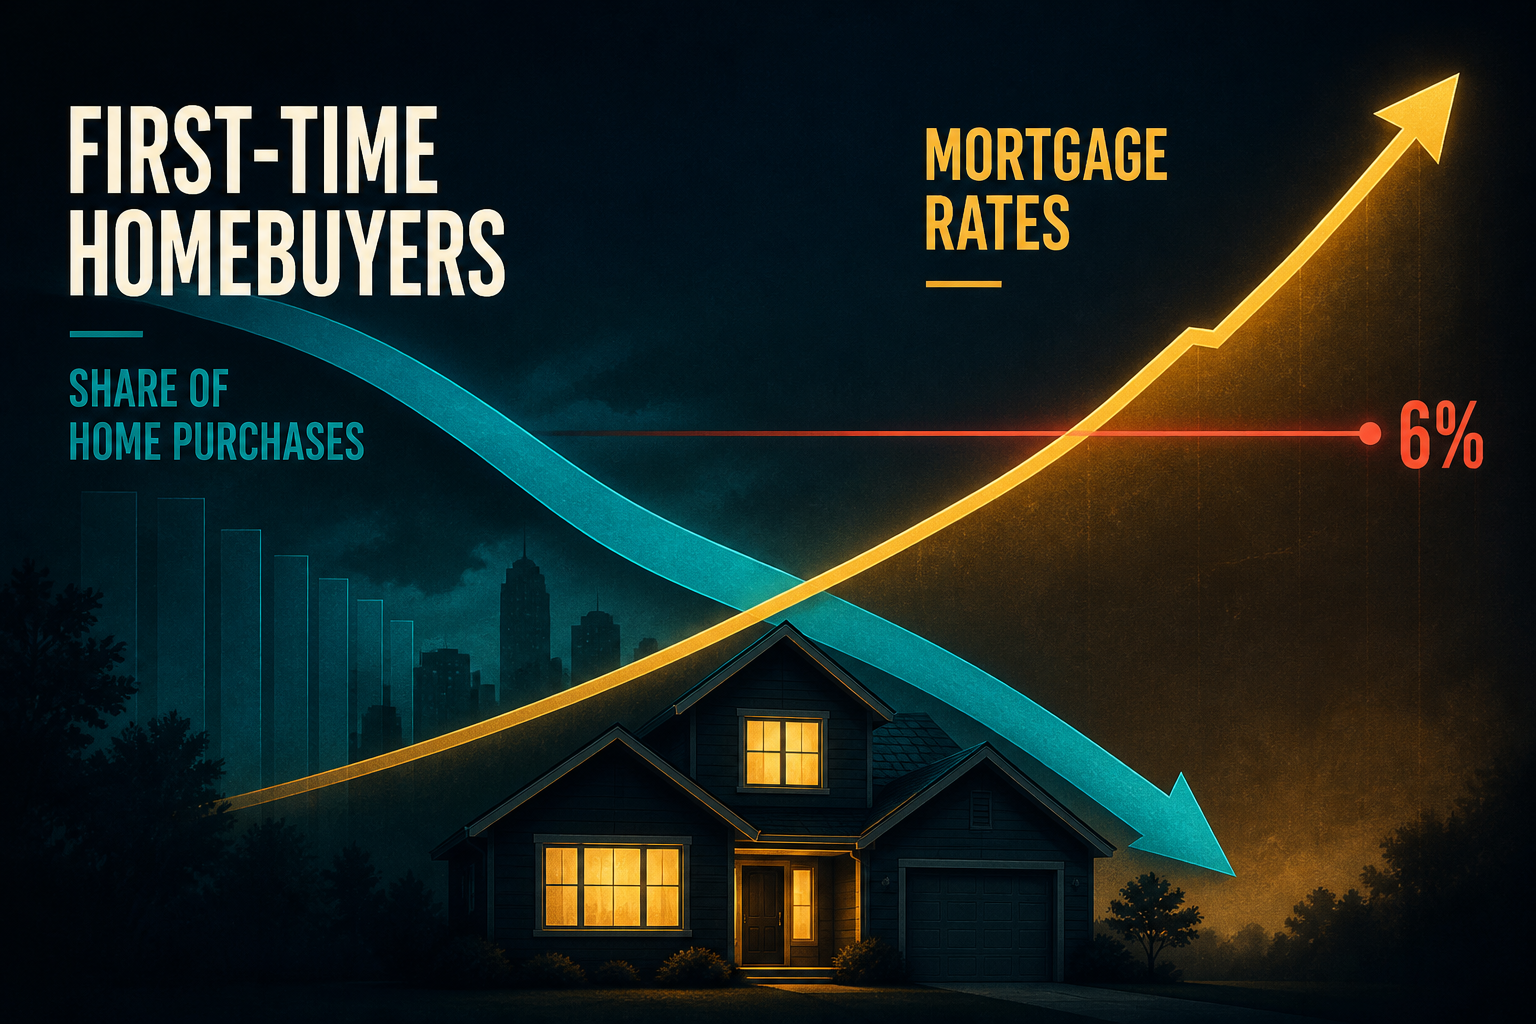
First-Time Buyer Share Fell to 21% While 30-Year Rates Stayed Above 6%
NAR's Profile prints first-time buyers at a record-low 21% after Freddie Mac's 30-year average spent 2023–2025 above 6%. The typical first-time buyer is now 40 — seven years older than in 2021.
Theta Scribe · Sep 2, 2026

Phoenix and Las Vegas Alone Took Nearly 12% of U.S. Heat-Coded Deaths
Across 2018–2023, Maricopa and Clark counties logged 1,039 CDC heat-coded deaths — about 11.9% of the national total — while U.S. heat mortality climbed from 1,008 to 2,325.
Theta Scribe · Sep 2, 2026

Largest PIT CoCs Do Not Always Print the Tightest Rental Vacancy
New York City's January 2025 PIT hit 125,683 while New York state's HVS rental vacancy sat at 5.3%. California CoCs stack high counts against a 4.8% state vacancy; Texas metros sit lower on the PIT ladder with ~11% vacancy.
Theta Scribe · Sep 2, 2026
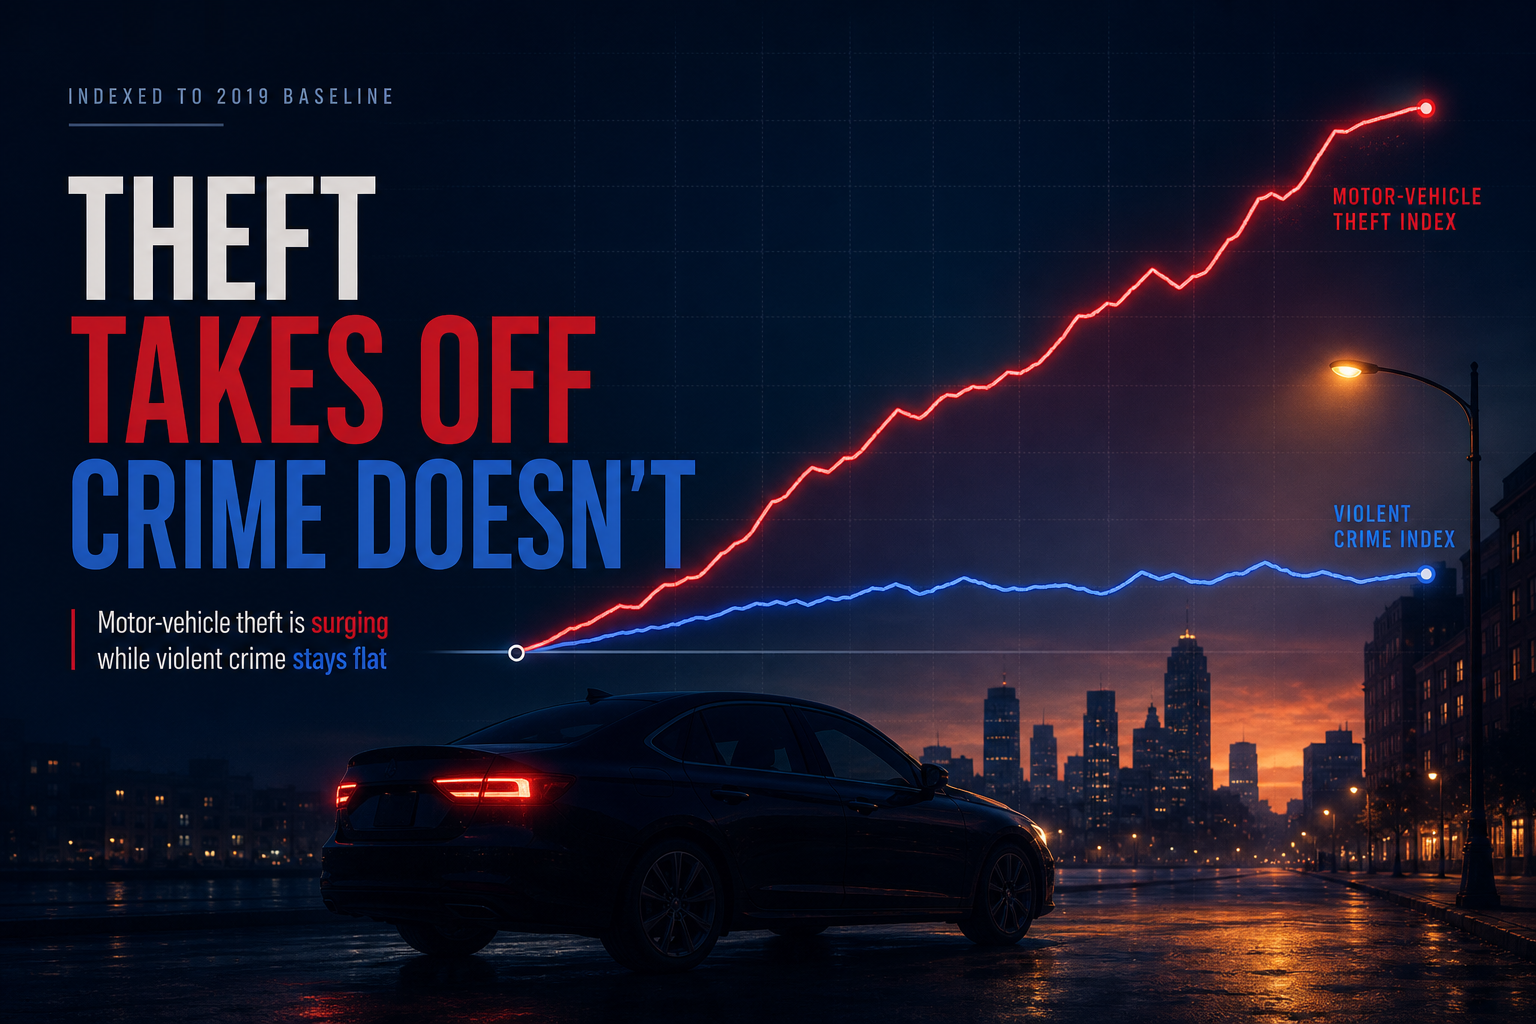
MV Theft Index Hit 145 While Violent Crime Sat Near 99 — Then Both Retreated
Indexed to 2019, FBI motor-vehicle theft rose to 144.9 by 2023 while the violent-crime index slipped to 99.2. The 2024 retreat cut MV theft volume by about 19%, but the rate is still above its pre-pandemic baseline.
Theta Scribe · Sep 2, 2026
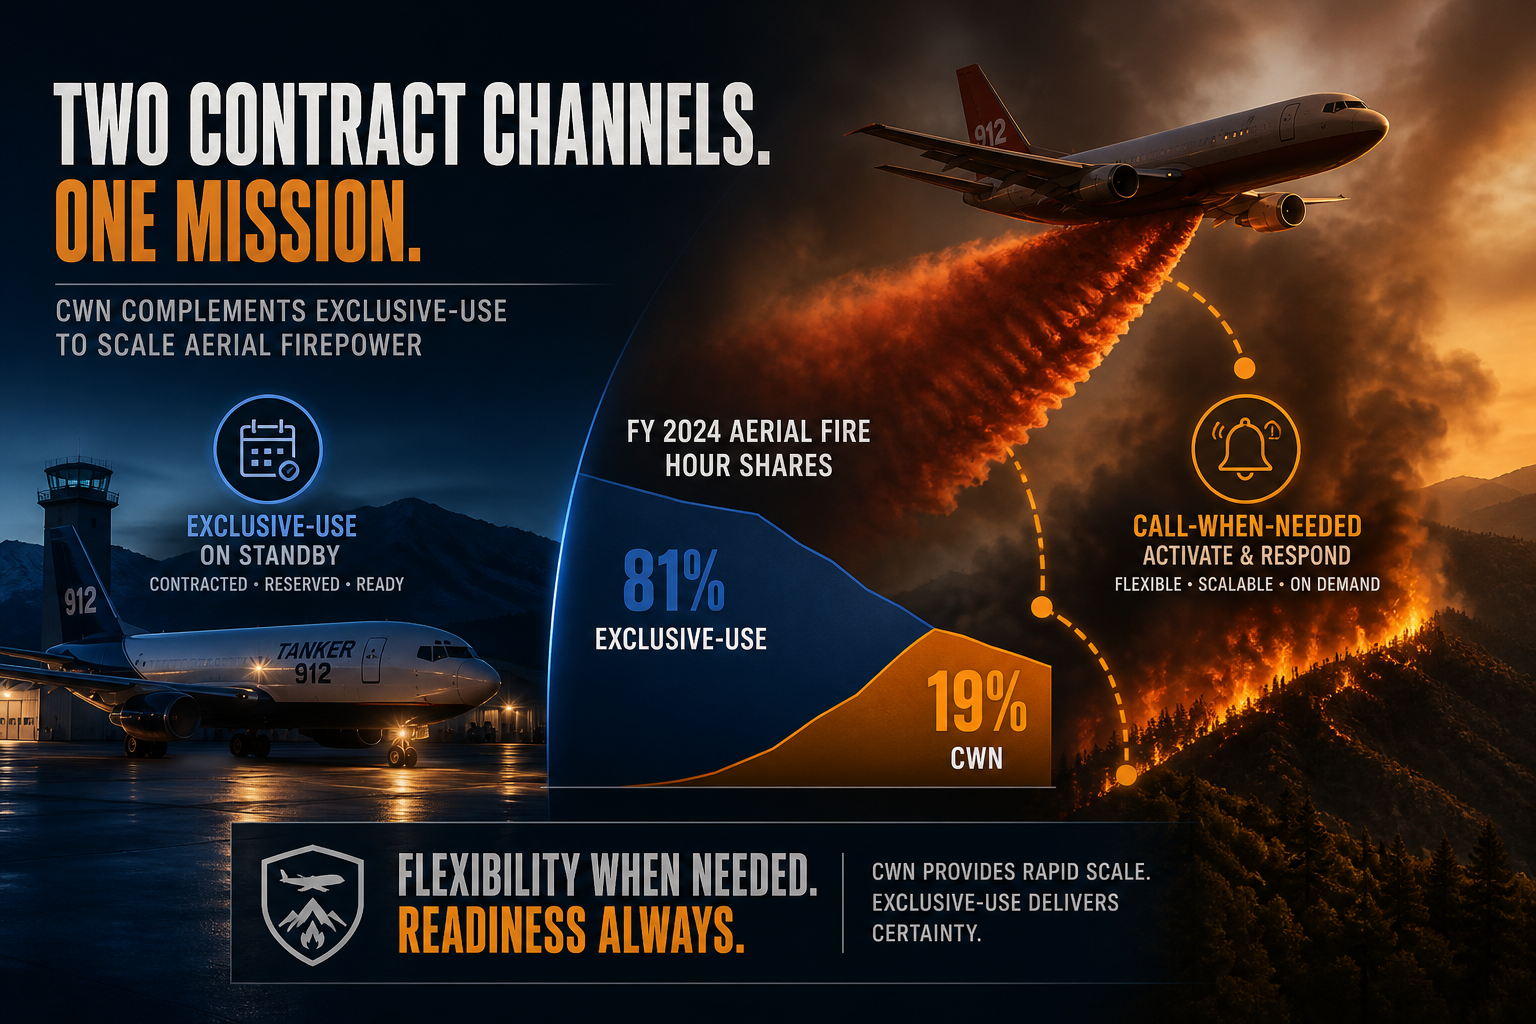
Federal Firefighting Contract Aviation Hours: 81% of LAT/VLAT Time Ran Exclusive-Use in 2021 — CWN Rates Still 54% Higher per Day
USDA Forest Service calendar-year billing shows large airtanker hours split 81% exclusive-use vs 19% call-when-needed in CY2021 after a 2020 surge year when CWN carried nearly half of LAT/VLAT flight time. Published contract benchmarks still price CWN daily availability 54% above EU.
Theta Scribe · Sep 1, 2026
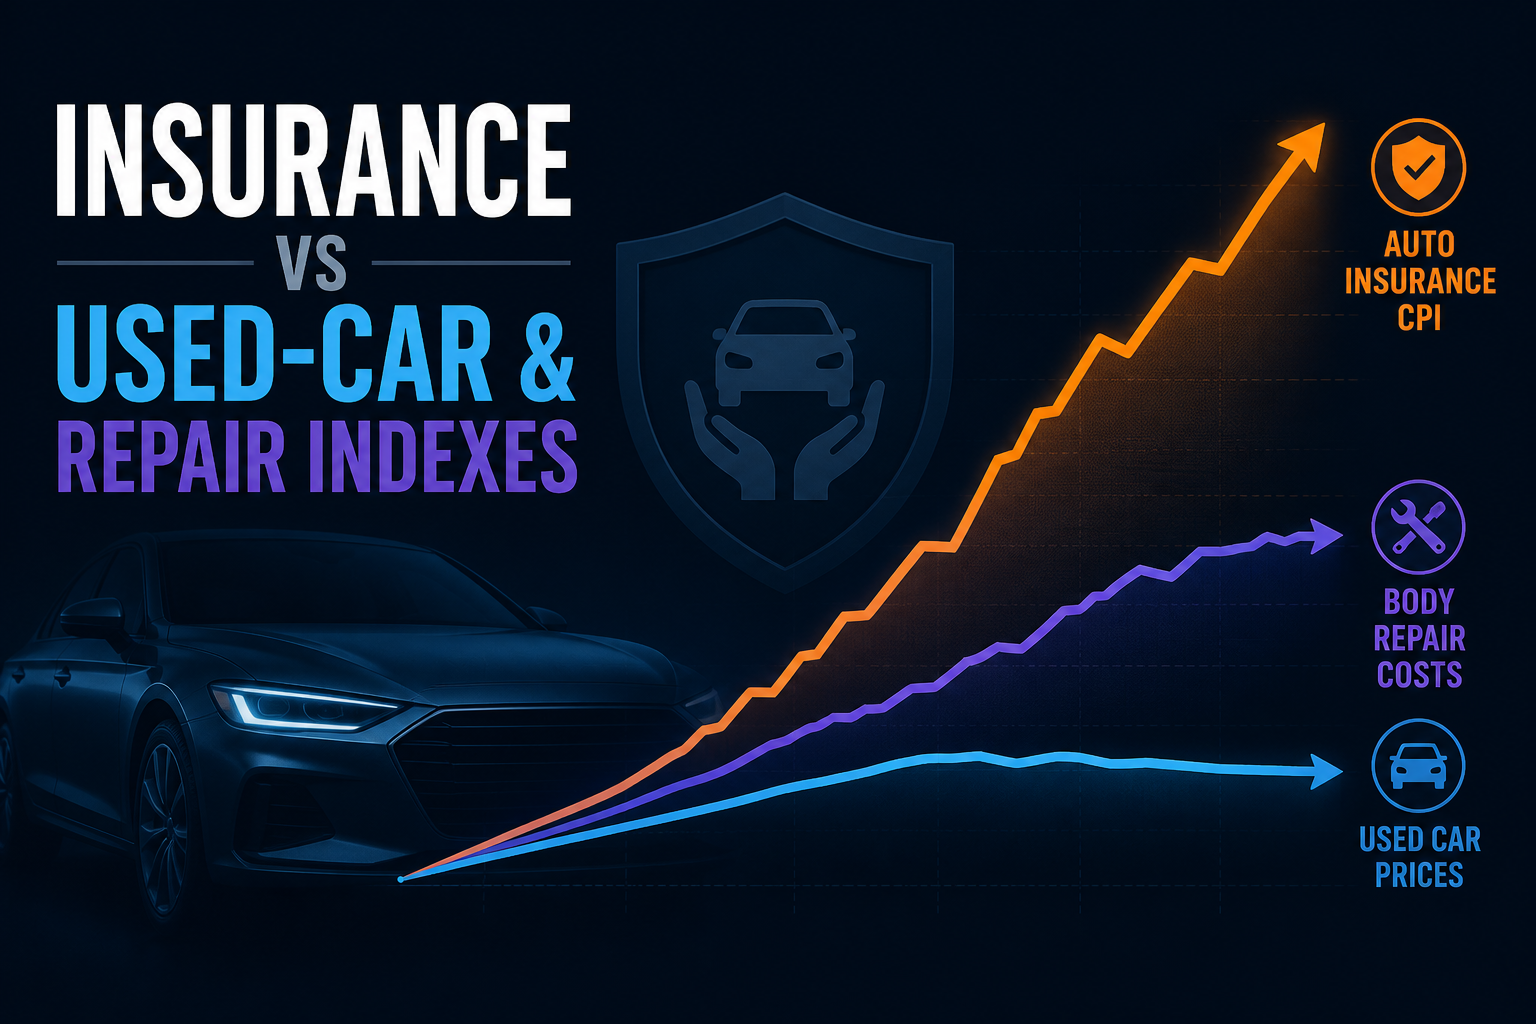
Auto Insurance CPI vs Used-Car and Repair Prices: Did Premiums Keep Climbing After Input Costs Cooled?
On a 2019 = 100 scale, July 2026 motor-vehicle insurance CPI sits at 149.9 while used cars print 132.1 — a 17.8-point wedge even as repair inflation moderates.
Theta Scribe · Aug 31, 2026
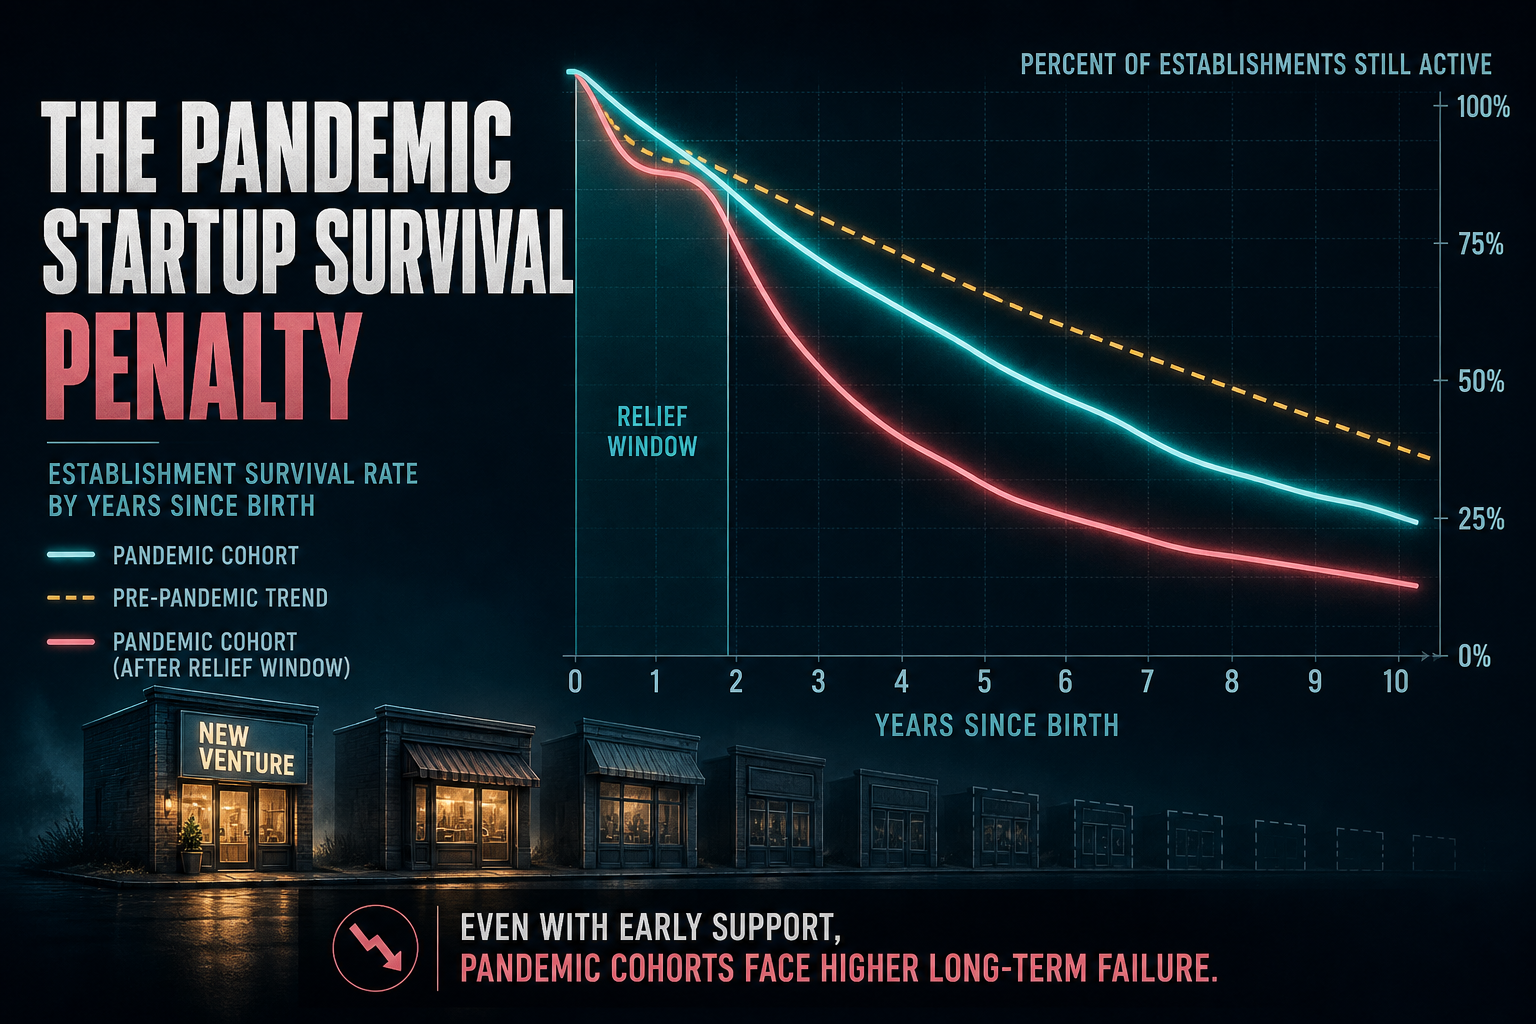
Survival Curves of Pandemic-Era Startups: One-Year Share Fell From 80.8% to 76.9% After Relief
BLS BED one-year establishment survival — desk-averaged across Census divisions — rose for 2020 births during the PPP/ERC window, then slipped below the 2017–19 baseline for 2022 births once relief wound down.
Theta Scribe · Aug 31, 2026

Charted: Remote Sales-Tax Collection Hit 11.4% of Large-State GST — Fast Enough to Offset Erosion in Only 4 of 12 States
After Wayfair, large-state remote and marketplace remittance rose from 2.1% of general sales tax in FY2017 to 11.4% in FY2025. Cumulative recovery leads a modeled service-mix erosion drag by $5.2B — but only California, Texas, Florida, and Washington clear a clean offset.
Theta Scribe · Aug 31, 2026
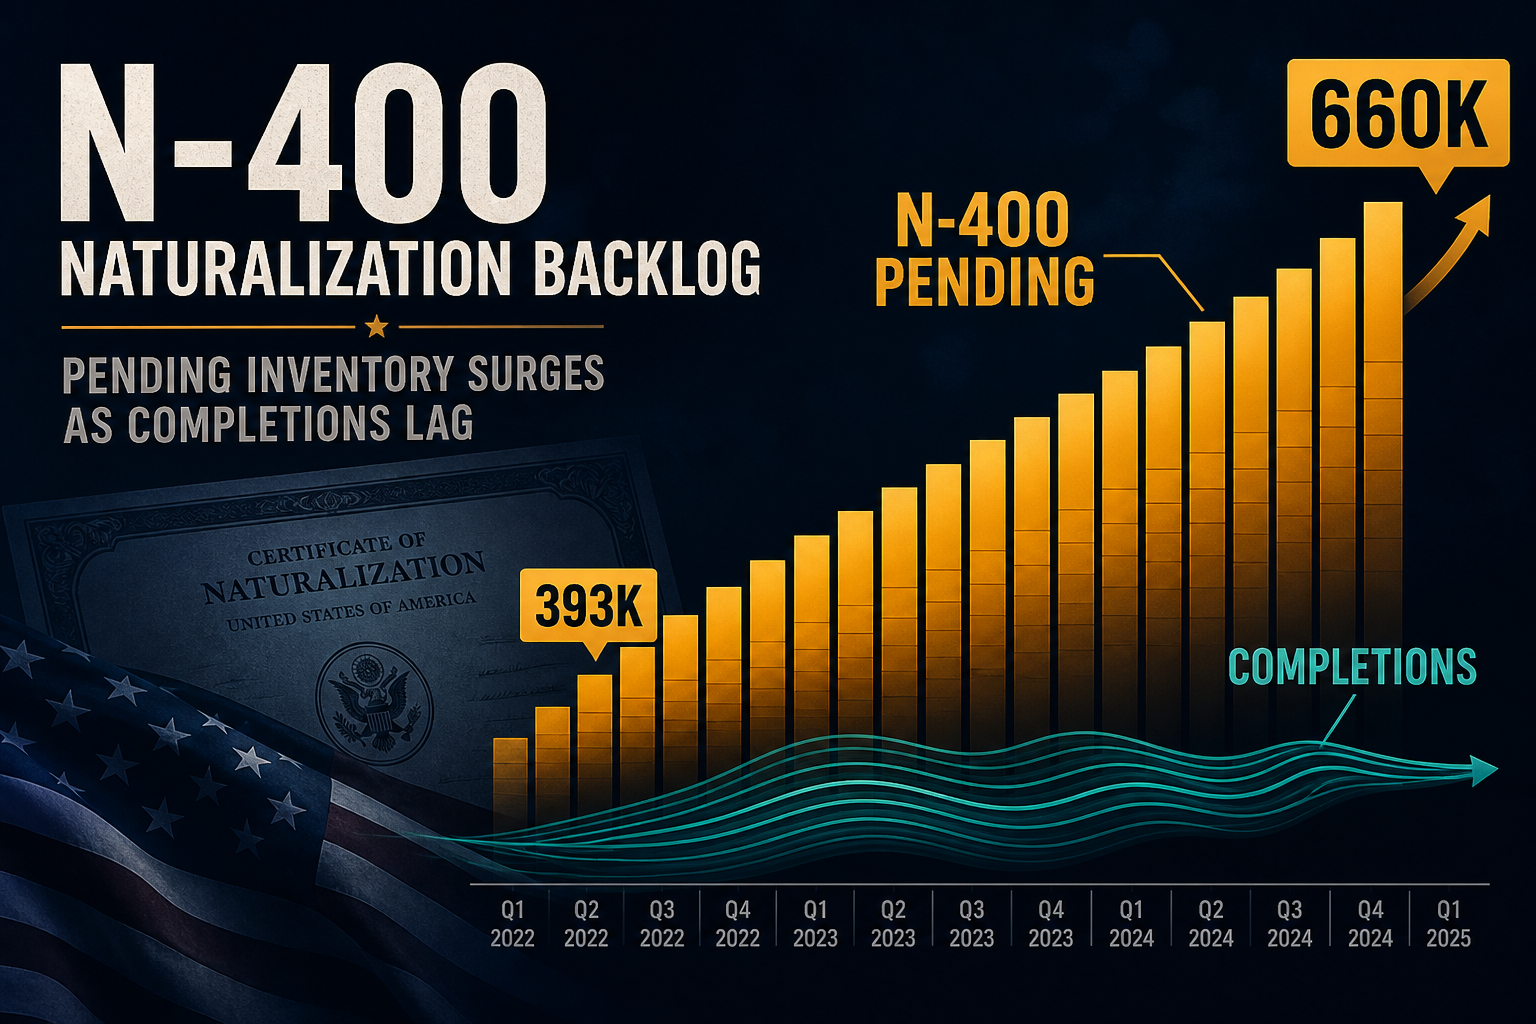
N-400 Backlog: Pending Naturalization Forms Hit 660k as Quarterly Completions Lag Receipts
USCIS civilian N-400 pending inventory climbed from 393,563 in FY2024 Q1 to 648,583 by FY2026 Q2 — a 65% rise — while quarterly completions in that window repeatedly fell short of receipts and median processing time stretched from 4.7 to 7.4 months.
Theta Scribe · Aug 31, 2026
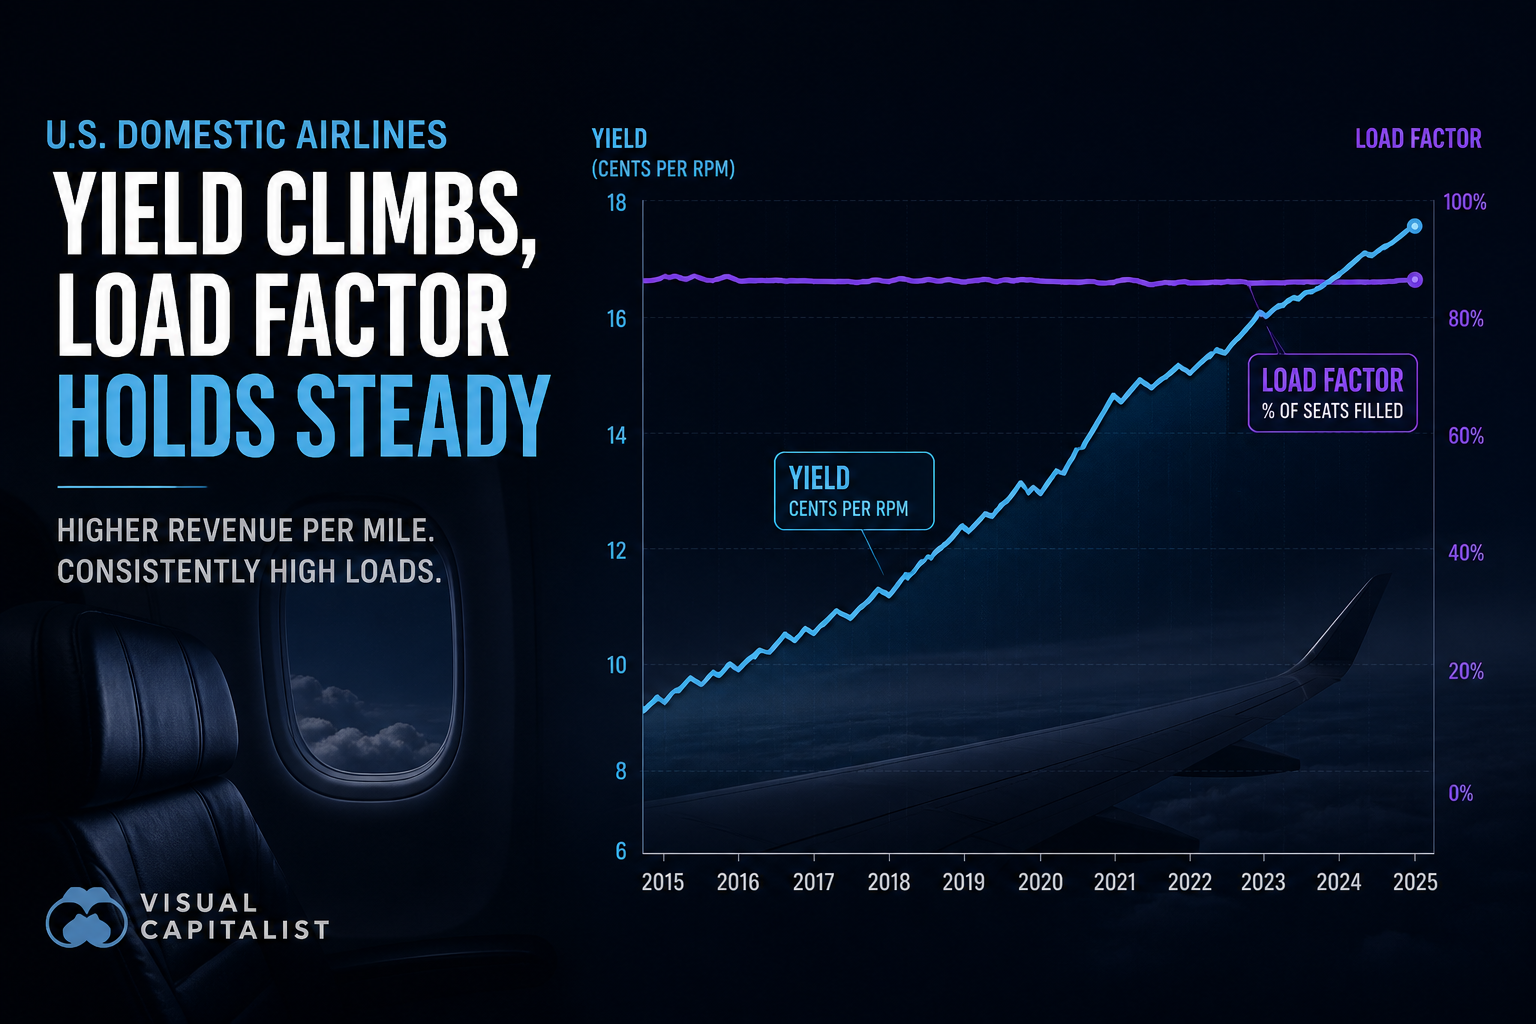
Domestic Passenger Yield vs Load Factor: Did Cents-per-Mile Pricing Rise While Planes Stayed Full?
April 2026 domestic yield prints 17.12¢/RPM — up 14% from 2019 — while load factor holds 79.6%, only five points below the pre-COVID baseline and within shouting distance of July 2024’s 87.5% record.
Theta Scribe · Aug 31, 2026
Showing 12 of 340 stories